7 Customer Satisfaction Metrics You Need to Bring into Play
Customer satisfaction metrics can not only help you understand whether your clients are willing to have business with you but also if there's room for improvement. Find out what they are here.
Written by Daniil Kopilevych

Keeping an eye on customer satisfaction – the very concept seems weird. It is either there or not. And yet, you need to monitor it in more than one way. For what reason?
The most obvious ground is that people are the central entity in most businesses, and whether they are happy with you or not is a key factor in your success.
It is that point on which everything hinges, and while clients may be hard-pressed to unpack the concept, we know metrics to measure customer satisfaction.
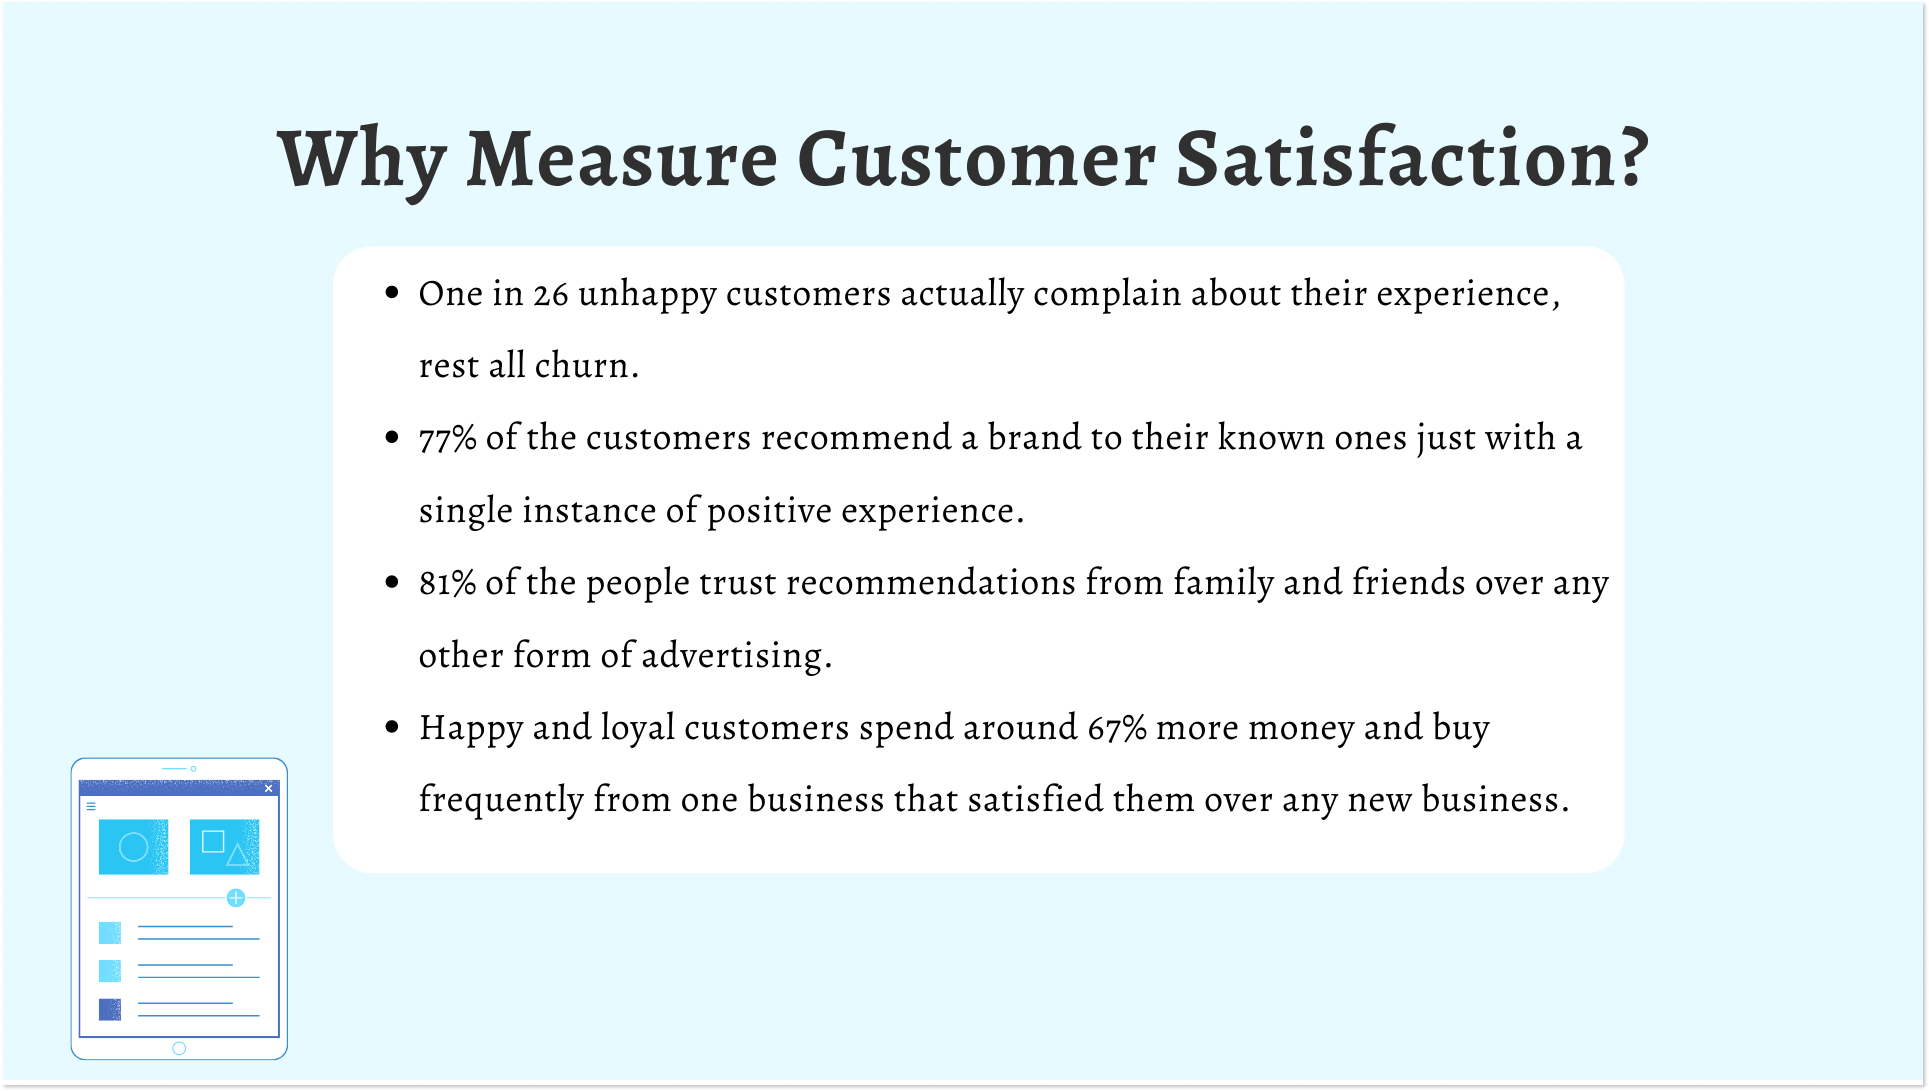
Why is customer satisfaction important?
If you can’t measure it, you can’t manage it.
These words by Peter Drucker apply to customer satisfaction metrics perfectly. Indeed, once you find a way to translate this ephemeral aspect into facts and figures, you will know how to make it work to your advantage.
By monitoring, you learn how much your clients are satisfied and can compare this level to a certain benchmark. You will immediately see whether you are OK or if some urgent actions are in order. In its turn, the increase in customer satisfaction will help you achieve quite a number of other goals.
Here are the benefits of measuring customer satisfaction metrics:
- Churn prevention. Customer churn is a key parameter that all businesses are afraid of and thus monitor very closely. Churn occurs when your existing customers abandon you. Tracking customer satisfaction helps you to keep an eye on the customer churn rate and react fast if it’s needed.
- Increase in customer retention, engagement, and loyalty. Satisfied customers become loyal. When you are happy with the product or service, you will hardly start looking for a different provider. The importance of metrics for customer satisfaction in this respect is difficult to overestimate.
- Word-of-mouth marketing. Word-of-mouth marketing or viral marketing is something many businesses will kill for. Your clients are advertising your brand of their own free will with no effort on your side. This is another reason for you to analyze customer satisfaction metrics – you can steer word-of-mouth marketing.
- Upsell generation and profit increase. A pleased customer is more likely to consider an additional service, a premium version, or a complementary product. In short, making customers happy opens wider opportunities for upselling, thus leading to higher profits – and isn’t it what you started your business for?
7 customer satisfaction metrics to capture
A theory should always be supported by practice, and this is what we are going to do now. What is the principle of metrics to improve customer satisfaction? The answer is simple – you ask. That’s it, to gather the data you need to survey customers. There is a catch, though – you should ask the right questions.
There is a whole line of different customer satisfaction metrics that allow you to evaluate the general level of your service as viewed by your clients. By interpreting special satisfaction survey results, you will get the knowledge you need to improve your performance.
Let’s look at the key metrics and how to measure them.
#1 Customer Service Satisfaction (CSS)
Benchmark: >90%
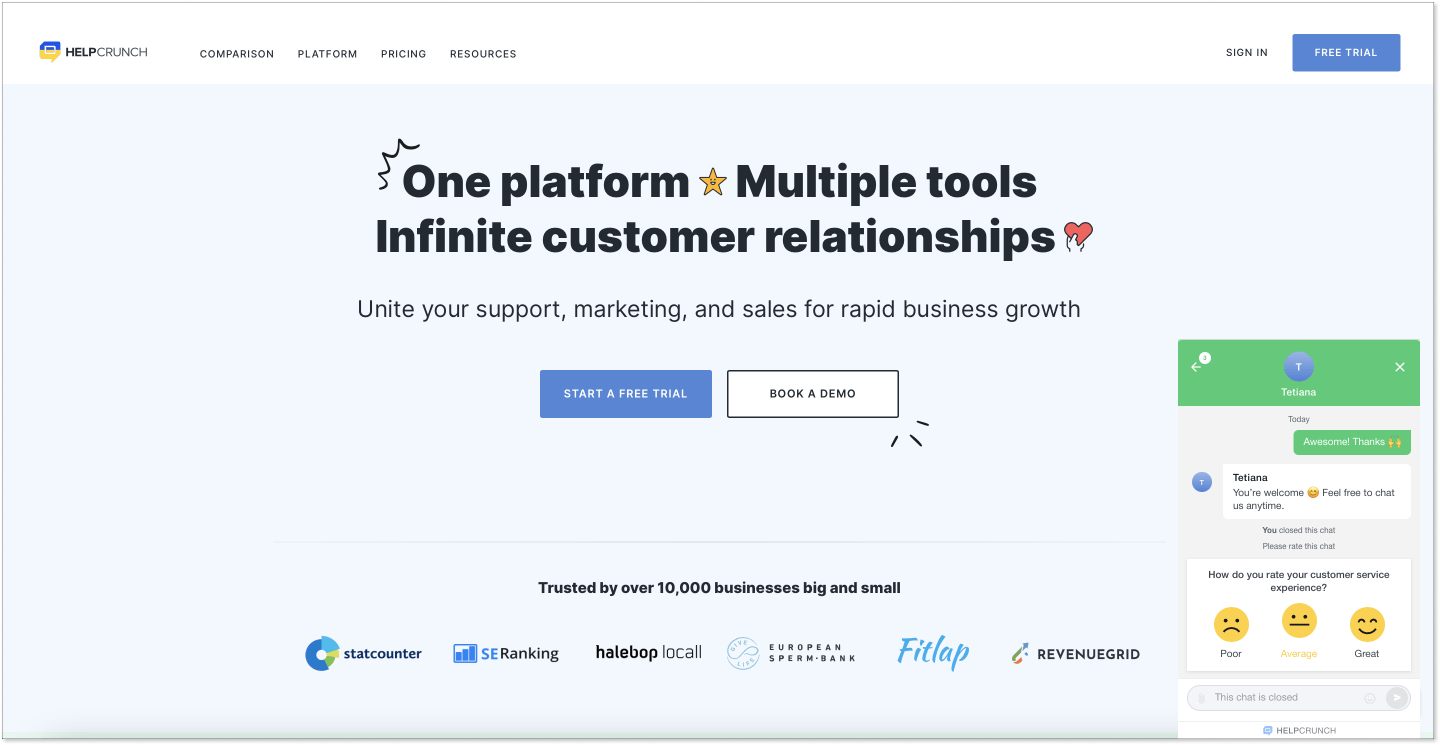
Customer Service Satisfaction shows exactly what the name suggests – how the customers are satisfied with your service. CSS can be measured by displaying a chat rating form after each interaction between the customer and the service.
For example, if you use a live chat by HelpCrunch, you can enable a satisfaction survey form right in the widget asking clients to rate the experience on a scale from “Great” to “Poor”.
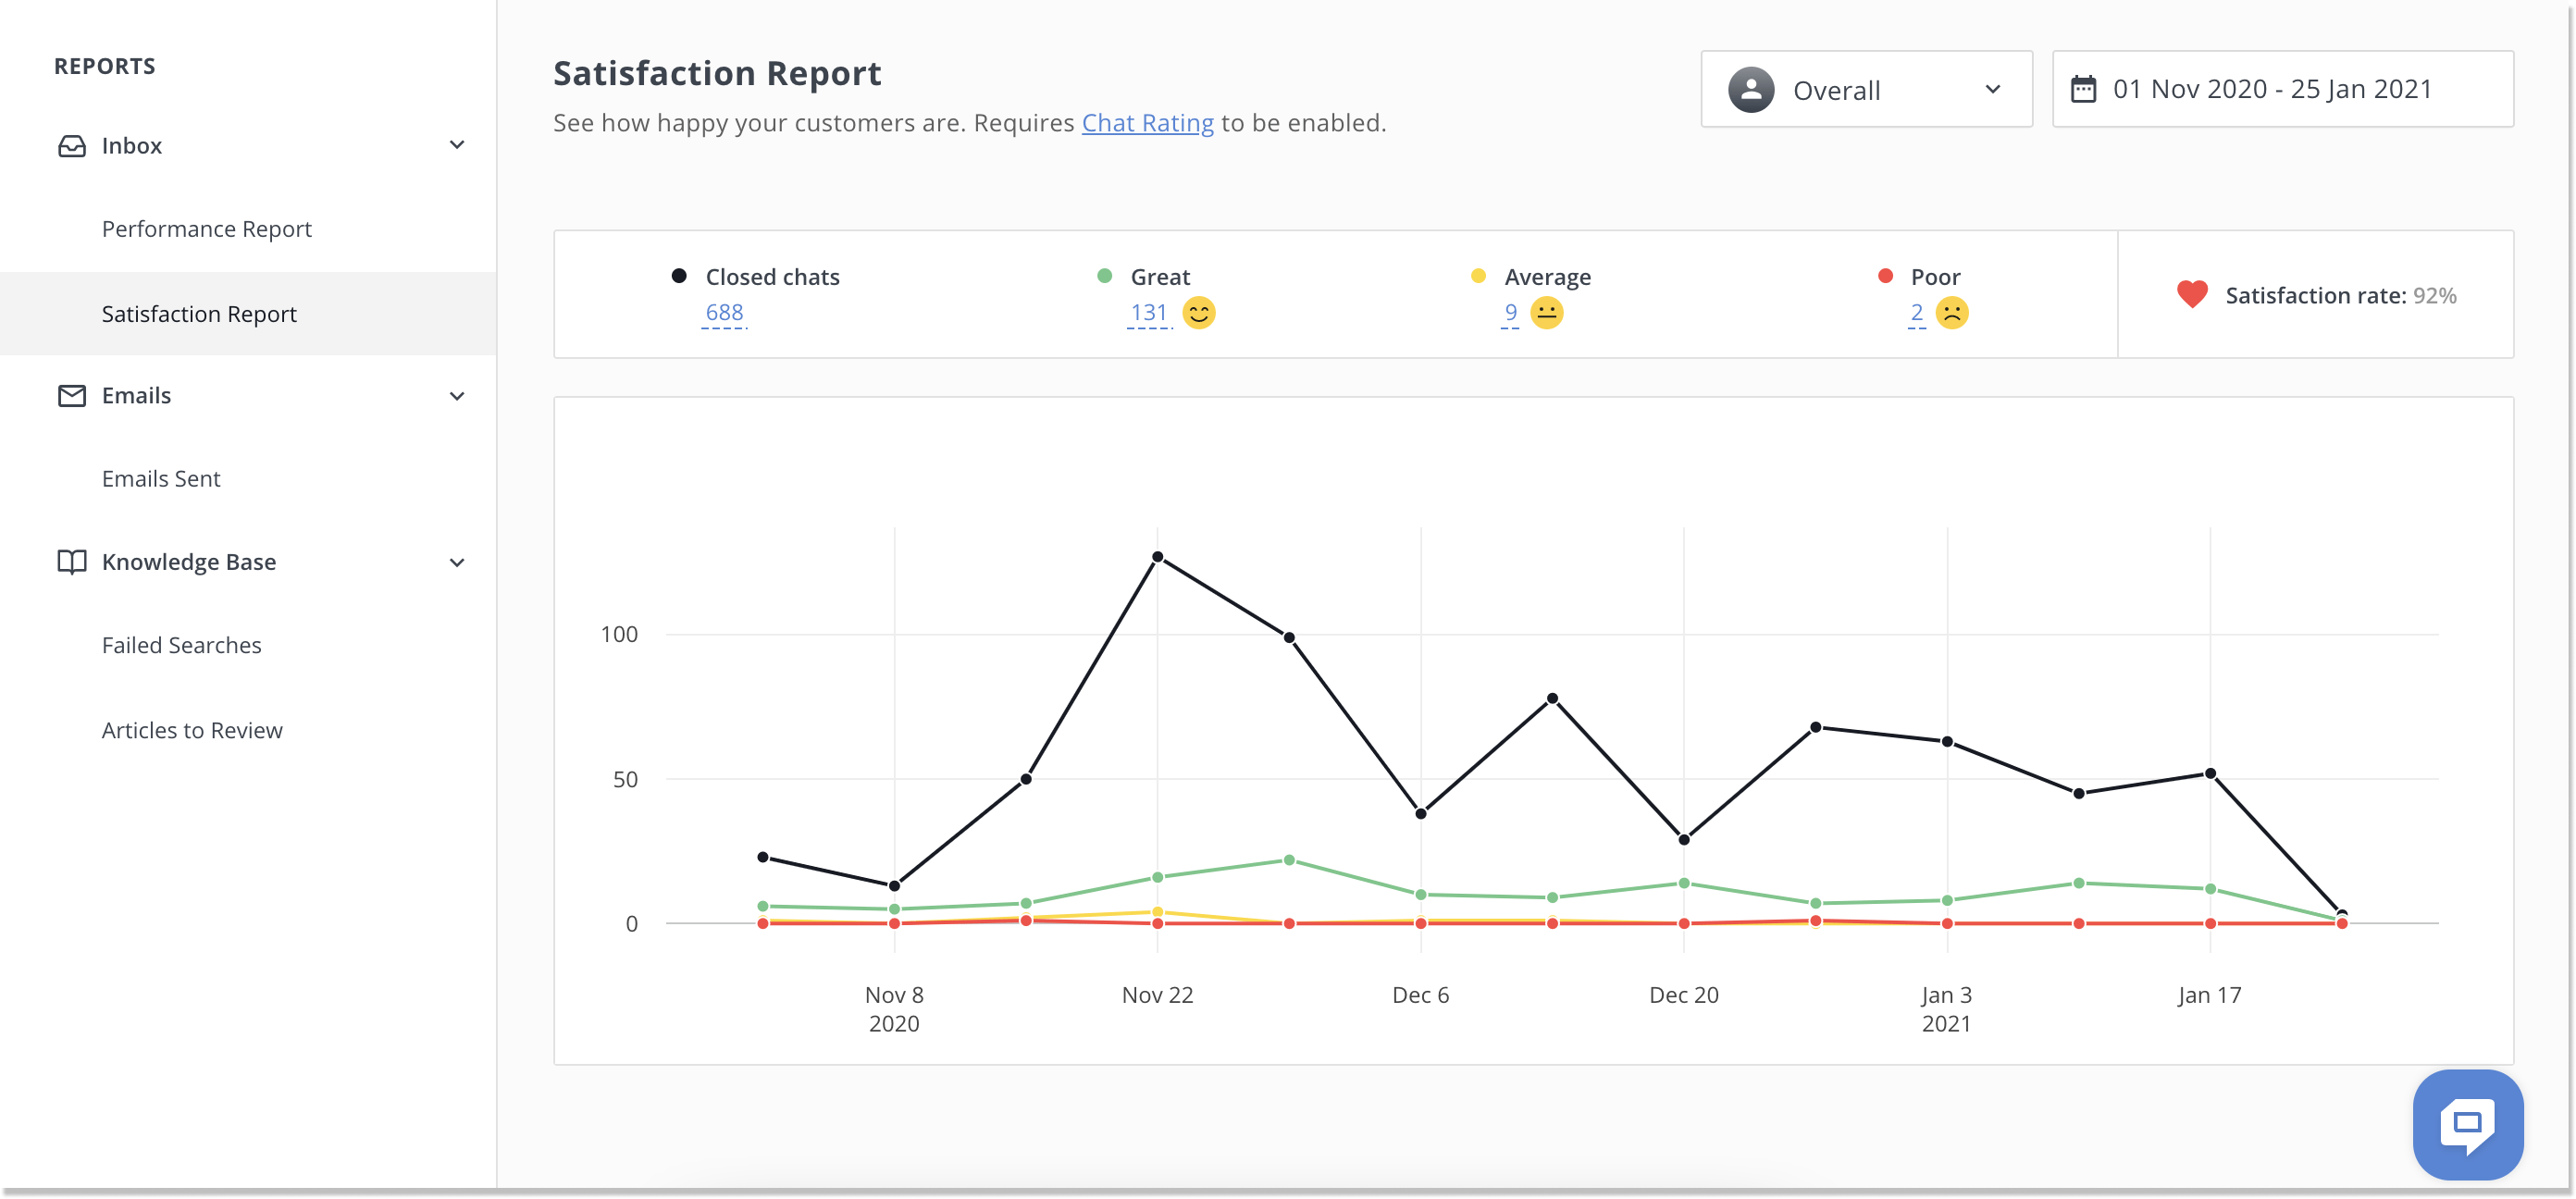
You can measure the given customer satisfaction metric on an ongoing basis and observe the trends and patterns. As you gather data over time, you will see where improvements are in order.
Usually, CSS surveys also provide an overall score showing how your customers rate your service. If, for example, 90% or more clients rated you as “Great”, there is, probably, nothing to worry about. However, if your score drops to 60-70%, that’s an indicator that you should initiate some steps.
The great thing about CSS is that you can collect it regularly without preparing and launching a special survey.
On the flip side, however, this customer satisfaction metric does not give you a complete picture of your product. It only shows how happy the customer is with the particular interaction. Still, this is valuable knowledge that can help you in your strategic planning.
#2 Net Promoter Score (NPS)
Benchmark: >70%
Net Promoter Score is one of the most important customer satisfaction metrics that shows how willing your customers are to recommend you. NPS is great in the way that it brings knowledge on more than one level. On the one hand, it shows viral marketing opportunities. On the other hand, it allows for estimating your business growth.
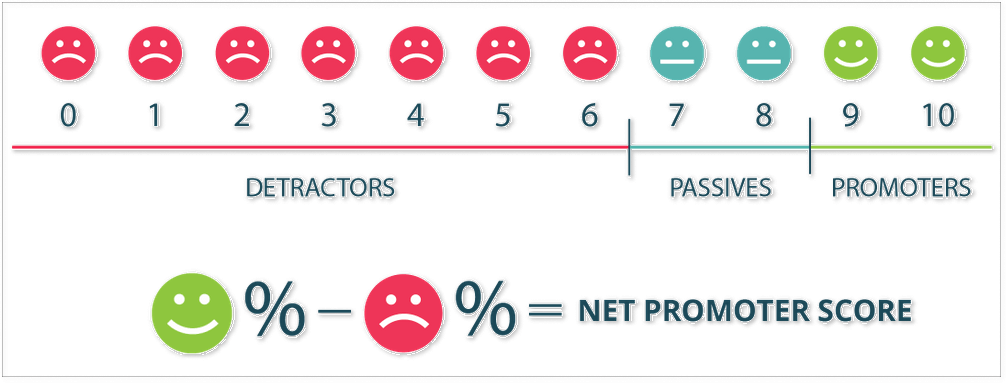
To measure NPS, you need to ask users just one question: On a scale from 0 to 10, how likely are you to recommend our company to a friend or colleague?
The results fall into three groups:
- Detractors (0-6). These respondents are unlikely to become your promoters. They may even play an adverse role by spreading negative comments about your business.
- Passives (7-8). People who rated their willingness to recommend you as 7 or 8 are, in fact, hardly likely to do so. However, they will not discourage others from using your product, either.
- Promoters (9-10). They are the loyal supporters that can refer you to others and promote your brand and product.
You can run this survey any way you want – in a chat, by email, or on your website. To calculate your NPS, subtract the share of detractors from the share of promoters.
What’s the benchmark? Of course, the higher, the better, but there are subtle nuances that you should take into account. First, NPS varies greatly between industries, with department stores getting the highest score. Thus, if you do not get the highest figure, it may be a common trend in your industry.
Second, while you should aim as high as possible, an NPS score of 60-70 is quite OK. An NPS of 100 means that every single customer is highly willing to recommend you. Does not look realistic, does it?
There is one aspect where NPS falls short. While it tells you that you are not performing as you should, it does not tell you why. However, there is a way to find this out, too. Just add a follow-up question to your NPS survey:
- For detractors and passives: What can we do to improve?
- For promoters: Thank you! What do you like about our product to rate it so highly?
This survey is also a great opportunity to gauge the Product-Market Fit – see whether there is a market for your product and whether your product satisfies this market.
You can do it by adding one more question:
- How would you feel if you could no longer use our product?
If 40% or more people are saying they are going to be very disappointed once your product disappears, this means the market is strong, and you can plan growth.
#3 Customer Effort Score (CES)
Benchmark: the lower, the better
Customer Effort Score determines how easy it is for a customer to use a product or service. Again, to measure CES, you need to ask a question. In this case, it is going to look as follows:
- Overall, how easy was it to..?
Depending on what you offer, finish the question with “…have your issue resolved”, “…install our application”, “…have a product returned”, and so on.
Let customers rate their experience on a scale from very easy to very difficult. You can even use emojis as ratings if you wish.
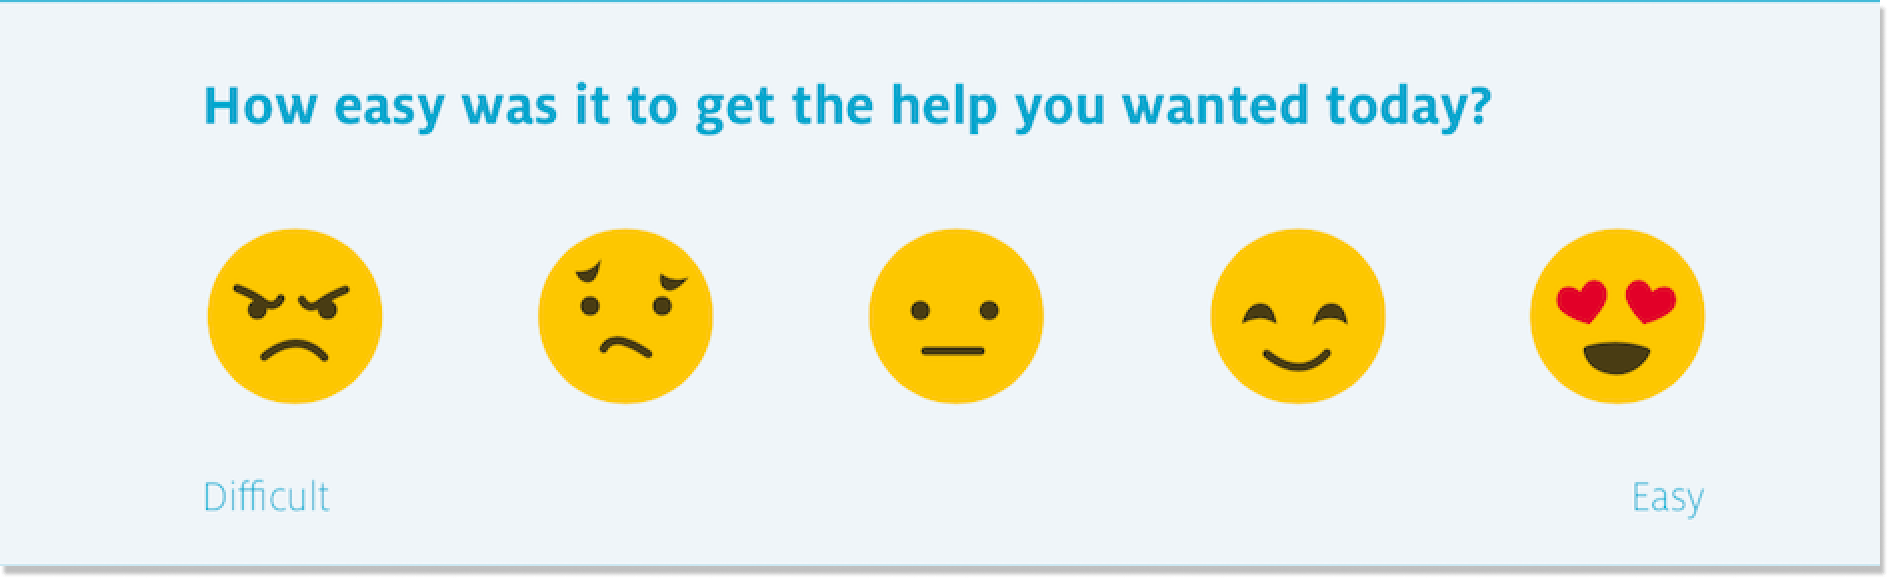
Your CES scale can have 5, 7, or 10 values, with 1 always representing “Extremely easy” and the highest number representing “Extremely difficult”. The effort score will be the average of all your responses. Obviously, the lower, the better.
Alternatively, you can have only 3 values – “Easy”, “Neither”, and “Difficult”.
In this case, subtract the percentage of “Difficult” responses from the percentage of “Easy” and discard the “Neither” and aim for higher scores.
Why do you need CES? It gives you an idea of customer loyalty to your brand and allows evaluation opportunities for word-of-mouth marketing.
Still, CES has its limitations – it only measures customer effort in connection with a single product or service without forming a complete picture of your business. But don’t worry, this is why we recommend using several ways for measuring customer satisfaction metrics.
#4 Customer Satisfaction Score (CSAT)
Benchmark: > 60%
Customer Satisfaction Score is one of the key customer satisfaction metrics as it is a rather straightforward way to find out whether your clients are happy with you or not. It is measured with an equally straightforward question:
- How would you rate your overall satisfaction with our product/service?
The CSAT is rated on a 1-5, 1-7, or 1-10 scale, with 1 usually being the worst experience the customer ever had.
Most often, a CSAT survey is offered to complete the customer experience of your product or service. This way, you can get the most relevant customer feedback immediately.
The CSAT is calculated as a percentage of satisfied customers in the total number of respondents. 70% or higher is considered good for the business. On the US market, CSAT usually varies from 60 to 80% depending on the industry.
The greatest advantage of the given customer satisfaction metric is that it is simple and intuitive. Moreover, since you usually offer a CSAT survey immediately following an interaction with the customer, they are still “in the context” of their experience and, therefore, can give the most realistic answer.
On the other hand, customers whose experience was unsatisfactory might simply refuse to answer the survey. This way, you may get results that show a higher percentage of satisfied clients while, in fact, their number is lower.
#5 Customer Health Score (CHS)
Benchmark: the more users get to the healthy group, the better
Customer Health Score indicates whether your client is going to remain with you or is about to churn. Unlike other types of customer satisfaction metrics, CHS does not use surveys. It is based on the observation of client behavior over time.
CHS uses a variety of factors. For example, you can process the following questions to measure it:
- How long do people use your product?
- How many products do clients use?
- Are they using a free version or a premium one?
- What number of upsells do you have?
- How much money do customers spend with you?
- How often do they contact your support team?
- How willing are they to participate in other surveys?
- Are top executives the users of your product (for B2B products and services)?
The methodology of calculating and analyzing a CHS for each business will vary with a different weight assigned to particular metrics. Unfortunately, there is no universal formula to calculate the CHS. Instead, there are a few steps you can take to track the metric:
- Depending on the industry and your business, specify the customer actions that are impacting the health score (ex., depth of product usage, upgrades, in-app chats, etc.).
- Assign an impact score to each action from 1 to 10.
- Track the frequency of these actions that customers take.
- Calculate the total action value for each action. Do this by multiplying the number of times the action was taken in the last X days by the impact score.
- The final step is to add all action values together to get the total customer health score for a specific user.
CHS = total action value #1 + total action value #2 + total action value #3 + …
| Key action name | Action impact on a scale of 1 to 10 |
Action frequency (last X days) |
Total action value |
| Key action #1 | 7 | 8 | 56 |
| Key action #2 | 2 | 14 | 28 |
| Key action #3 | 5 | 45 | 225 |
| … |
Sounds overwhelming but don’t let your head go crazy, once you set up the tracking process it won’t take much time, yet will allow you to have the full picture. What’s important is that at the end of the day you will be able to place your users into three main groups: healthy, at-risk, and poor.
It is critical not only to define CHS for each client but to observe it over time. A healthy user showing a steady decline in their health score requires close attention, otherwise, it can affect other customer satisfaction metrics.
#6 Customer Churn Rate (CCR)
Benchmark: <7% annually for SaaS
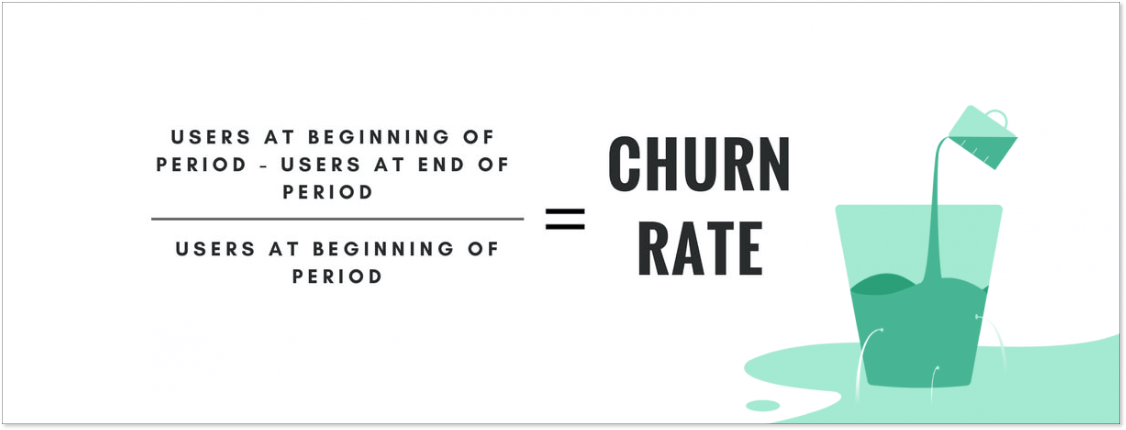
Customer Churn Rate is the percentage of clients you lost over a certain period. Getting new customers is much more expensive than retaining the existing ones. Thus, it is important to monitor your churn, too, in order not to miss a negative trend.
To calculate the churn rate, you need to determine the period for which you are going to calculate it. Then subtract the number of users at the end of the period from the number at the beginning of the period. Divide the result by the number of customers at the beginning, and you will get your churn rate.
CCR is a rather comprehensive customer satisfaction metric that shows whether there is a problem. Then it’s up to you to find reasons for clients dropping out and take steps – adding new services or adjusting the existing ones, introducing reminder messages, etc.
The benchmark churn rate depends on the company size and type. Generally, a good CCR for SaaS falls between 5%-7% for annual churn and under 1% for monthly churn.
#7 Online ratings/reviews
Benchmark: > than 4 out of 5
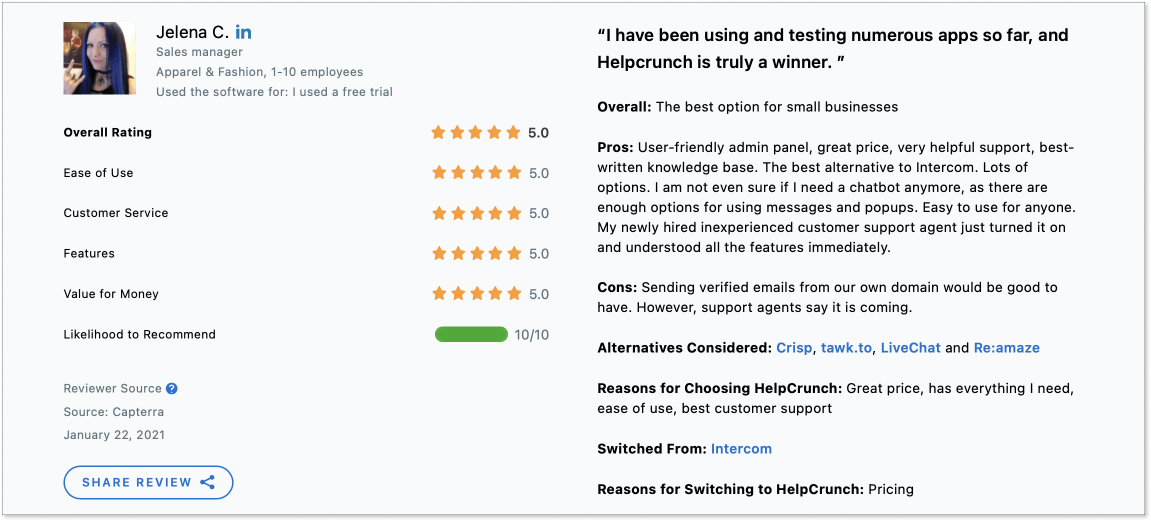
Adding an online review option to your product or service is another way to measure customer satisfaction metrics. Besides, it’s a great technique for increasing your customer base and boosting sales. Why? Because 90% of users value online reviews higher than product descriptions by brands.
We always look for those stars next to the product name and will hardly buy something with just one or two stars. So don’t hesitate and create your brand profile on dedicated review websites like Trustpilot, Yelp, Capterra, or G2 Crowd. Let your users express themselves and evaluate your product.
In the context of online reviews, there are two main recommendations:
- Make sure your product is good enough to encourage positive reviews
- Provide an option for customers to rate your product and write a review
No matter where you look, the general concept is the same – the higher, the better. If your rating is 4.6-5, you are OK.
The rating of 4-4.5 is also good but suggests that there is room for improvement. If, however, your rating drops below 4, there is something wrong, and you need to plan urgent measures.
Metrics to measure customer satisfaction in the form of online ratings allow monitoring your market position in real-time and your standing against your competitors.
For another thing, they can sometimes be a bit far from objective as some companies create high ratings artificially while others do not even bother to remind to rate the service.
Bonus: Other customer satisfaction metrics
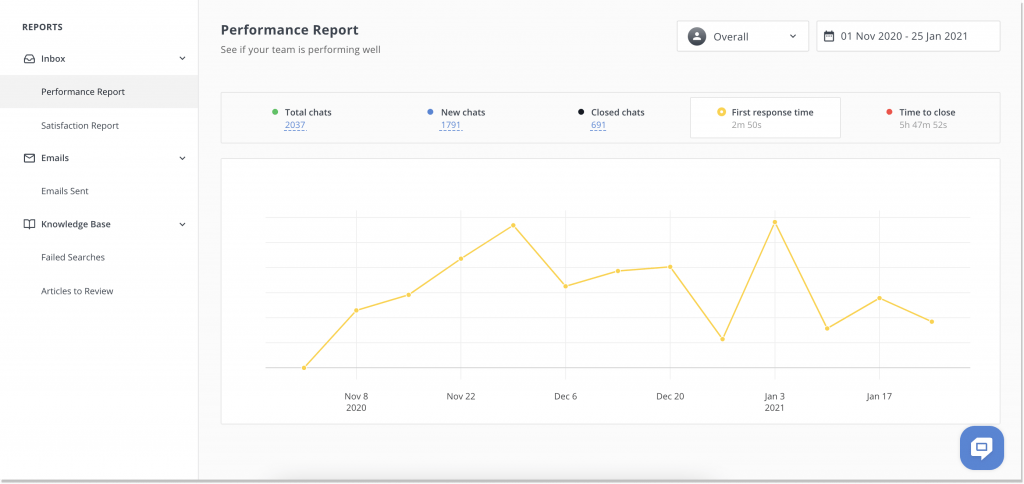
Customer satisfaction is a multi-layered concept that can be measured from lots of angles. In customer service, it may be a good idea to monitor such special metrics as first response time and time to close. People appreciate it when you value their time, thus, include time-related metrics into your analytical toolset.
Benchmark for the first response time in chat: < 2 min
First response time shows how long it takes for your agents to pick up a call or chat. Keep the first response time as short as possible. If you find that your customer service takes too long to respond, it may mean that you need more agents on board or additional automation tools (chatbot, for instance). Alternatively, think of introducing additional training courses for your agents, so that they handle customer requests quicker.
Speaking of chat support, the best time to reply is within 40 seconds but basically, anything that goes under 2 minutes is fine.
Benchmark for time to close in chat: < 10 min
Time to close shows how long it takes to resolve a customer issue. Again, this knowledge is important in the context of customers valuing their time and wanting their issues to be cleared as fast as possible. The time you should aim for is 10 minutes or less.
Most customer communication tools like HelpCrunch include the options for monitoring the first response time and time to close. You can follow the trends and patterns and see where improvement may be in order.
Sure, there are other customer service KPIs and metrics you can use in your workflow. Decide which are relevant for your business, set them up according to your specifics, and you will have a complete picture of your customer satisfaction level.
How to improve customer satisfaction metrics?
Now that you have collected your data, the logical question is what to do with the knowledge you obtained. Make it work for your benefit – use it for product improvement or to boost the quality of your service.
Here’s the action plan for customer satisfaction improvement:
- Choose the types of satisfaction metrics that are right for you.
- Analyze the results to see the points of improvement – you may find that customers have issues with your product, have difficulties in communicating with your support, or consider your pricing strategy far from optimal.
- Take measures to improve the shortcomings that you identified.
- Keep gathering the metrics to see whether the steps you took have the desired effect.
Bottom line
By now, you may feel a bit overwhelmed with the number of metrics to measure customer satisfaction and the various methodologies of calculating them. Indeed, it may be a complex task. However, there is a way of making it easier: use a customer communication tool with analytical features.
This way, you will only need to set up a platform following your business goals, and it will return the metrics you require in any form you wish – on a visual graphic dashboard or in a separate report. For that, create an account with HelpCrunch, and you will see how much useful information it can bring.