14 Crucial Customer Service KPI Metrics to Gauge
Setting up goals and measuring effects are integral parts of success in any business.
Written by Anastasiia Khlystova

Customer relationships sound like too intangible a notion to measure. It operates in the world of emotions, moods, undertones, and spur-of-the-moment decisions. Yet, there are some ground rules you can use to calibrate your support performance. That’s where customer service KPIs and metrics come to the rescue.
A customer service Key Performance Indicator (KPI) is a measurable value that demonstrates how effectively a company achieves its key business objectives. Sounds good, doesn’t it? Especially the part about achieving business objectives.
That’s why setting the right customer support KPIs and metrics helps business owners and managers determine whether their support team is up to par during the whole customer journey. It’s also one of the most effective methods to motivate employees and give them their well-earned rewards.
So, what are the key customer service performance indicators? Swift responses and short resolution time are great. But here’s something even better: not locking yourself into a single metric when evaluating the performance of your customer success team.
Make your team better by introducing the following 14 customer service KPIs and metrics and setting a tangible reward system for achieving them.
Note!
KPIs measure progress toward specific goals, and metrics gauge the overall business health. But even though KPIs and metrics for customer service are different things, they do have a lot in common. So, you may notice how some concepts and quantities intersect.
Customer service KPIs
If you don’t measure any KPIs and metrics in your company, you can never say how your business performs. Monitoring just the revenue won’t give you the right insights to keep growing, either.
Instead, gauging every aspect of your company operations will allow you to make critical adjustments in the execution to achieve your strategic goals faster.
1. First response time
Benchmark: Depends on the industry’s customer service standards and communication channels.
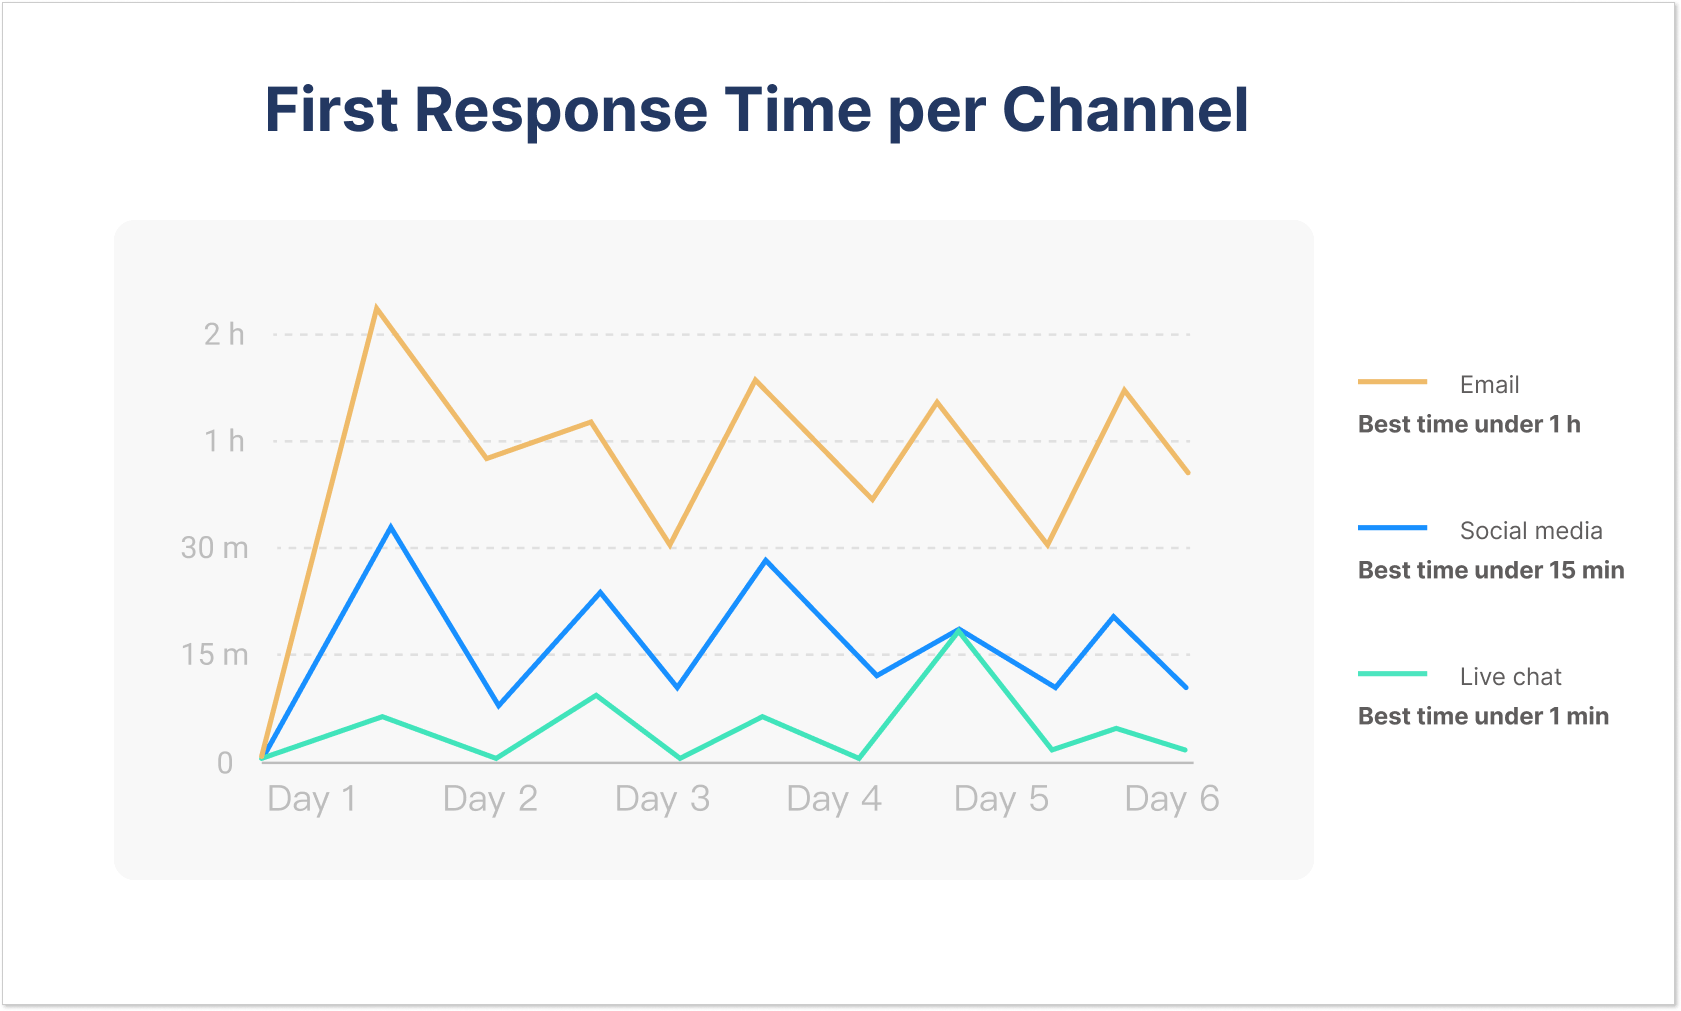
The main task here is to not let your customers feel abandoned. Even if you can’t solve the issue immediately, send something as simple as ‘Our team is already looking into the issue, we’ll keep you updated’ and make users feel heard.
That’s why the first response time is one of the most important KPIs for customer service. Keep an eye on how long people have to wait on hold before someone greets them.
If you see that messages pile up for hours without a reply, it’s probably time to grow your team, review their performance, and improve some processes. Things like canned responses and knowledge base integration can also help to speed up the process.
It’s also important to note that auto-responders don’t have the same effect. Their sole role is to confirm that a message did land in your customer service inbox. The answer from a real human is what counts (so make sure it reads as such).
2. Revenue growth
Benchmark: Depends on the size of your business. On average, companies fall between 15% and 45% for year-over-year growth. Startups should target a 15%+ Net MRR Growth Rate (month-over-month).
You can be the most customer-driven company in the world, but every business should earn money. And being on the frontline of customer communications, support representatives should have a vested interest in bringing in more money and customers.
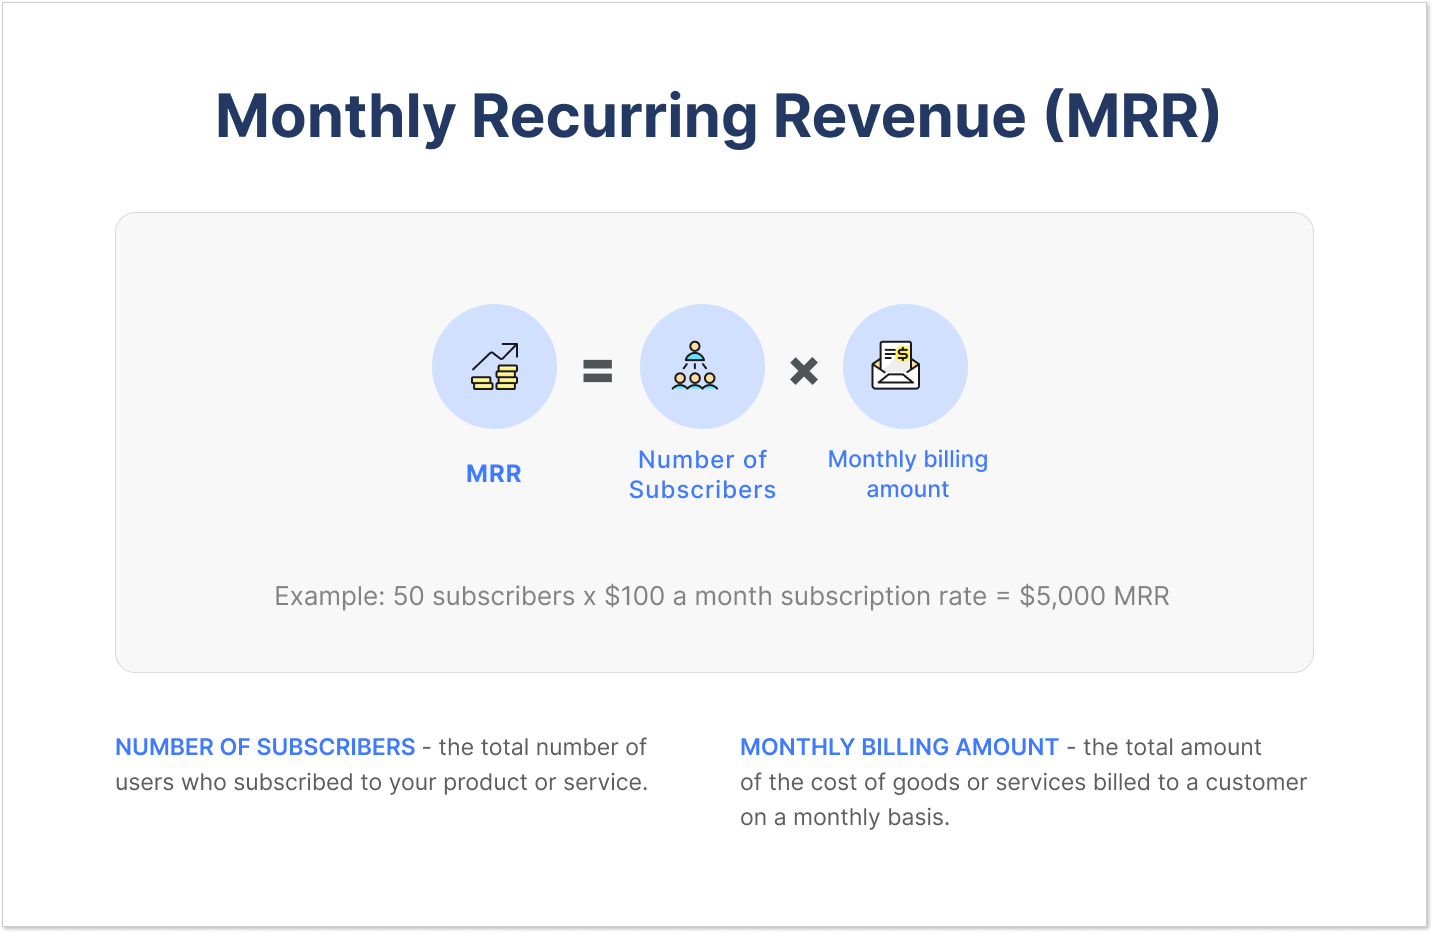
For instance, we at HelpCrunch think that monthly recurring revenue is one of the most important customer service KPIs. So, our customer service reps’ biggest bonuses are tied to the MRR growth.
Yes, MRR as a customer support KPI makes perfect sense. Support specialists need to be tied to money stuff and stay on top of everything that’s going on in your company. You’ll instantly see the change in their attitude.
Sometime after implementing MRR as a customer service KPI, our live chat agents told me they began to think differently and concentrate on more relevant stuff rather than just answering routine chats. As a result, they were getting more bonuses, which is a win-win situation for everyone — for the business, for CSMs, and our customers.
Pavel Pavlenko, Co-founder & CEO of HelpCrunch.
It may sound counterintuitive to some people. What does technical support have to do with selling and growing revenue? Isn’t it a sales department’s job? Well, yes and no.
For one thing, sales and customer success teams should work together in close collaboration to achieve the best results. While the former can push the right buttons and razzle-dazzle, customer service agents can provide knowledgeable advice and put people in the right direction. And that’s exactly what they should do — close deals on the go.
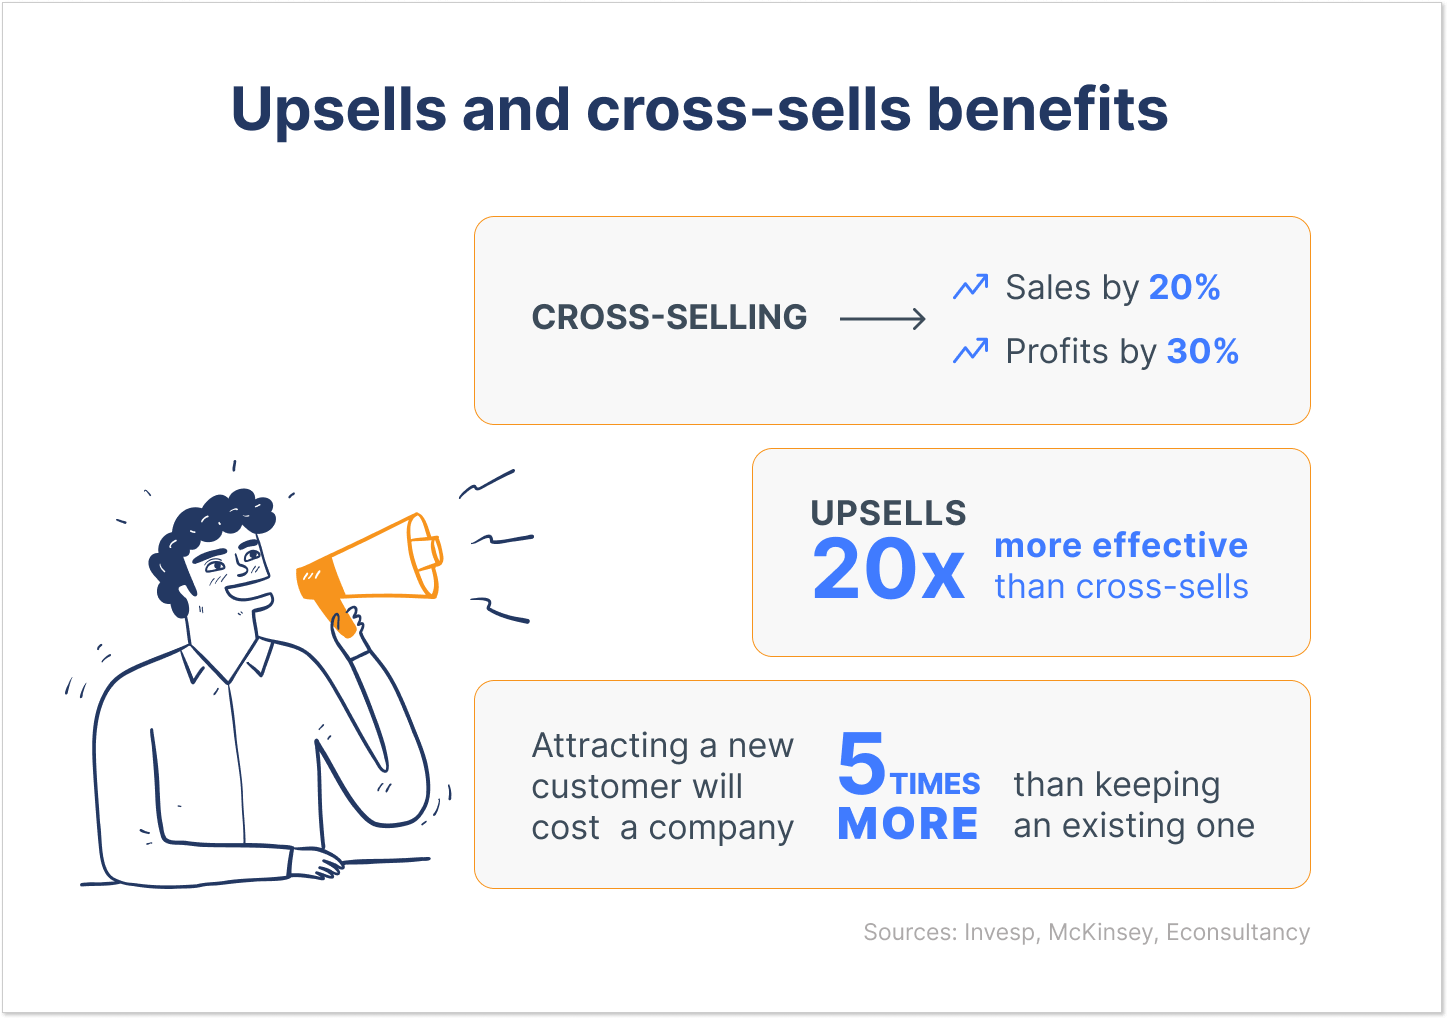
3. Upsells and cross-sells benefits
Benchmark: you can increase your profits by as much as 30% with cross-selling. It’s more cost-effective to cross-sell and upsell to existing customers than acquire new ones.
As I say, it’s not your typical customer service experience to cross-sell or upsell. But sometimes, the opportunity just presents itself, and it would be a total waste to miss it.
The main rule of a successful sale is to always think about the customers, not the business. You should genuinely try to help and resolve the issue with your product or service. Think about how the user will benefit from upgrading their subscription or buying additional stuff.
And who would know customers’ pain points and objectives better than a customer service staff member who communicates with them every day? That’s the reason upselling and cross-selling often happen in customer service. Agents could organically offer an upgrade as a solution to the user’s issue — that’s your upsell right there.
4. Demo-to-registration conversion rate
Benchmark: a conversion metric ranges from 4% to 26% for software products. Read how to improve the demo-to-conversion rate with one question. Here is a quick bar chart demonstrating a conversion rate metric by industry:
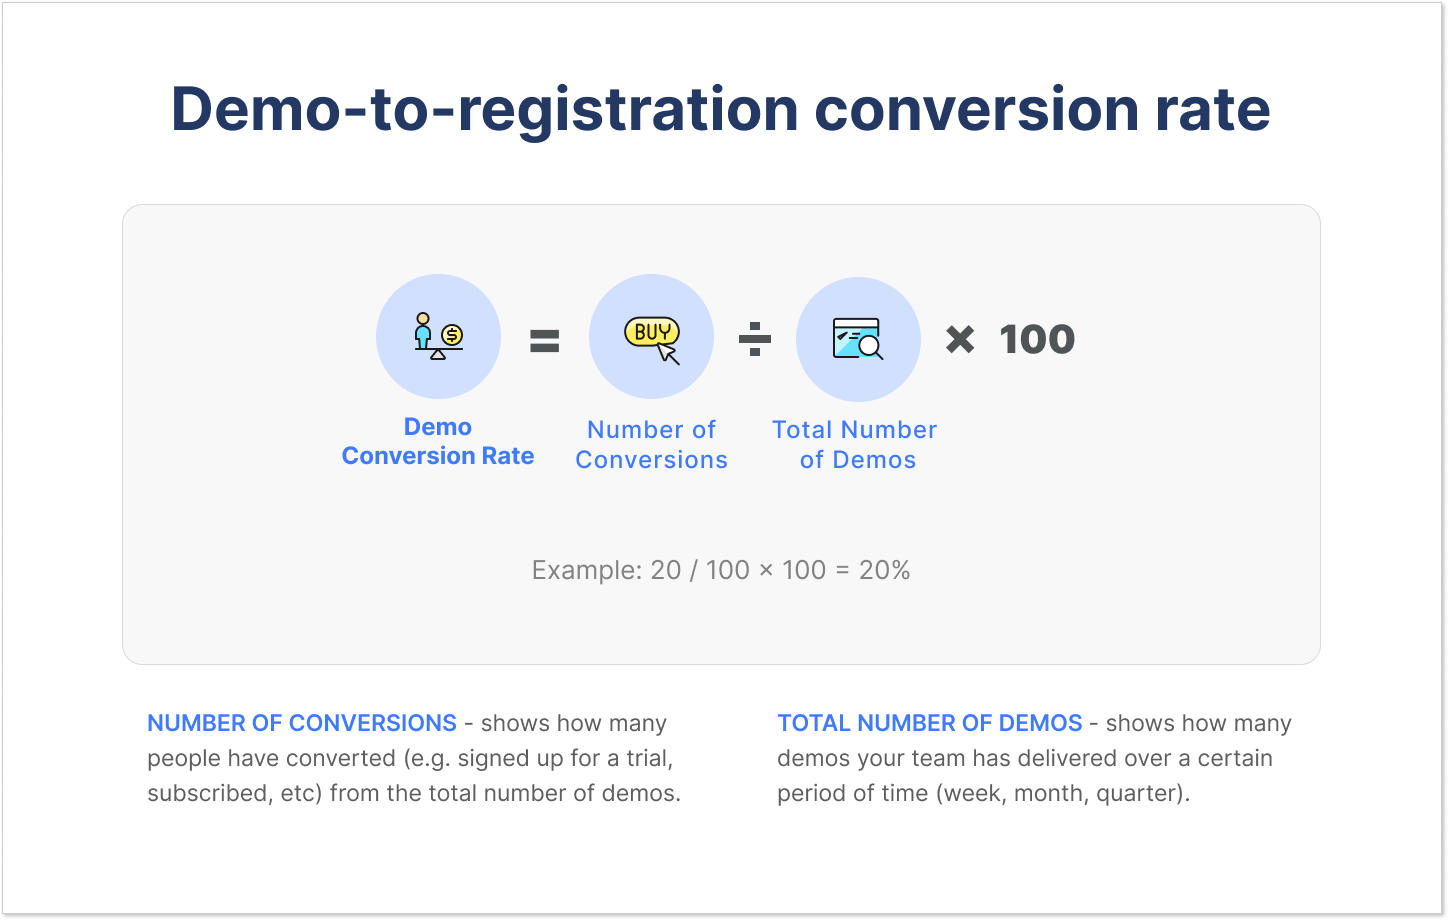
Customer support agents know all the ins and outs of your product and can show it in the best light. That’s why it’s always a good idea to delegate some of the demos to them and track their effectiveness. Are people interested in knowing more about your business? Are they more willing to convert after talking to your customer support team?
Product demos shouldn’t take more than 20–30 minutes of their time, but their effect is much more powerful than that of any other channel. Once people see how your business can solve their problems in real time, making a buying decision is much easier.
That’s why you should encourage your customer service team to provide more demos and webinars and track how many leads sign up for your product after them. Just remember that this part of the job is optional. Don’t push too hard — and reward those who manage to achieve the monthly goal.
5. Acquired reviews benefits
Benchmark: Having many positive reviews on platforms like G2 or Capterra increases the likelihood of convincing customers to make a purchase.
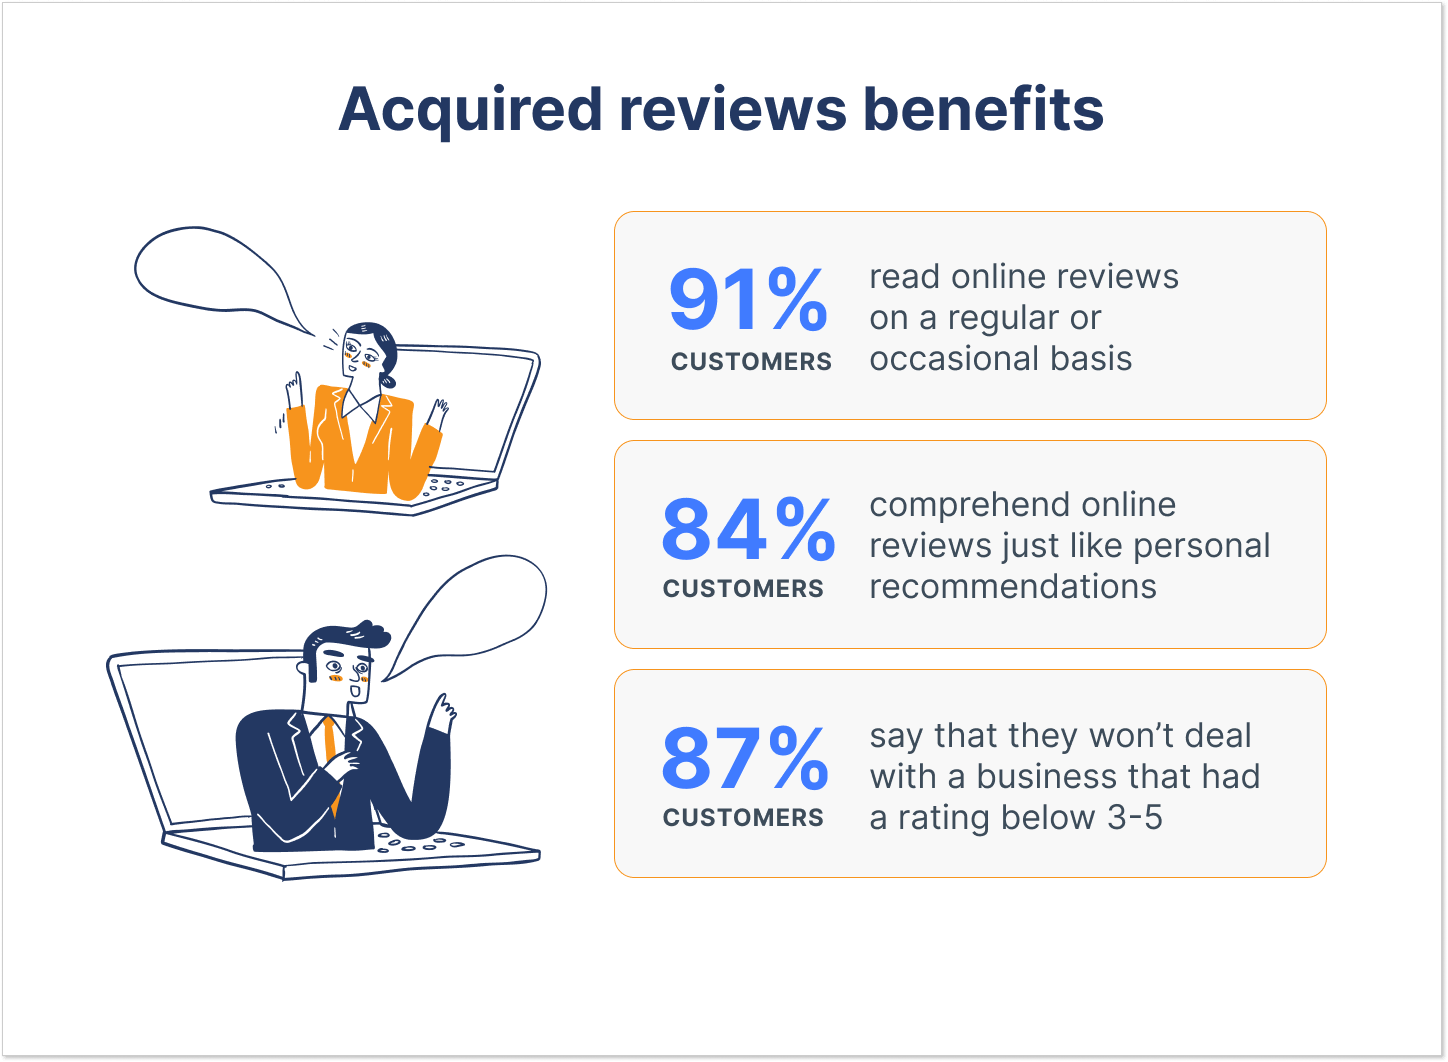
Statistically speaking, people who had a negative experience with a company are more likely to leave a review. And you guessed it right — it’s going to be a negative one. A satisfied customer, on the other hand, is unlikely to leave a good review. Long story short, people won’t rate your business on designated websites without a nudge.
There are all kinds of marketing campaigns (like email or social media promotions) aimed at collecting reviews from customers. But no one can get positive feedback better than a customer service representative.
You should train your support team to spot satisfied customers who are likely to leave a positive review. If someone complimented your company on its products or customer service, react accordingly:
- Ask for a quick review;
- Provide links to relevant review websites;
- Offer a small discount or upgrade in return (if it’s allowed!).
It might feel a bit awkward at first, but remember that satisfied customers rarely leave reviews unless you ask them to. That’s why using the number of reviews as a customer KPI will motivate your team to push forward.
6. Knowledge base benefits
Benchmark: Knowledge base articles help prevent long wait times in a customer service queue as they address questions that would otherwise have to be answered by employees.
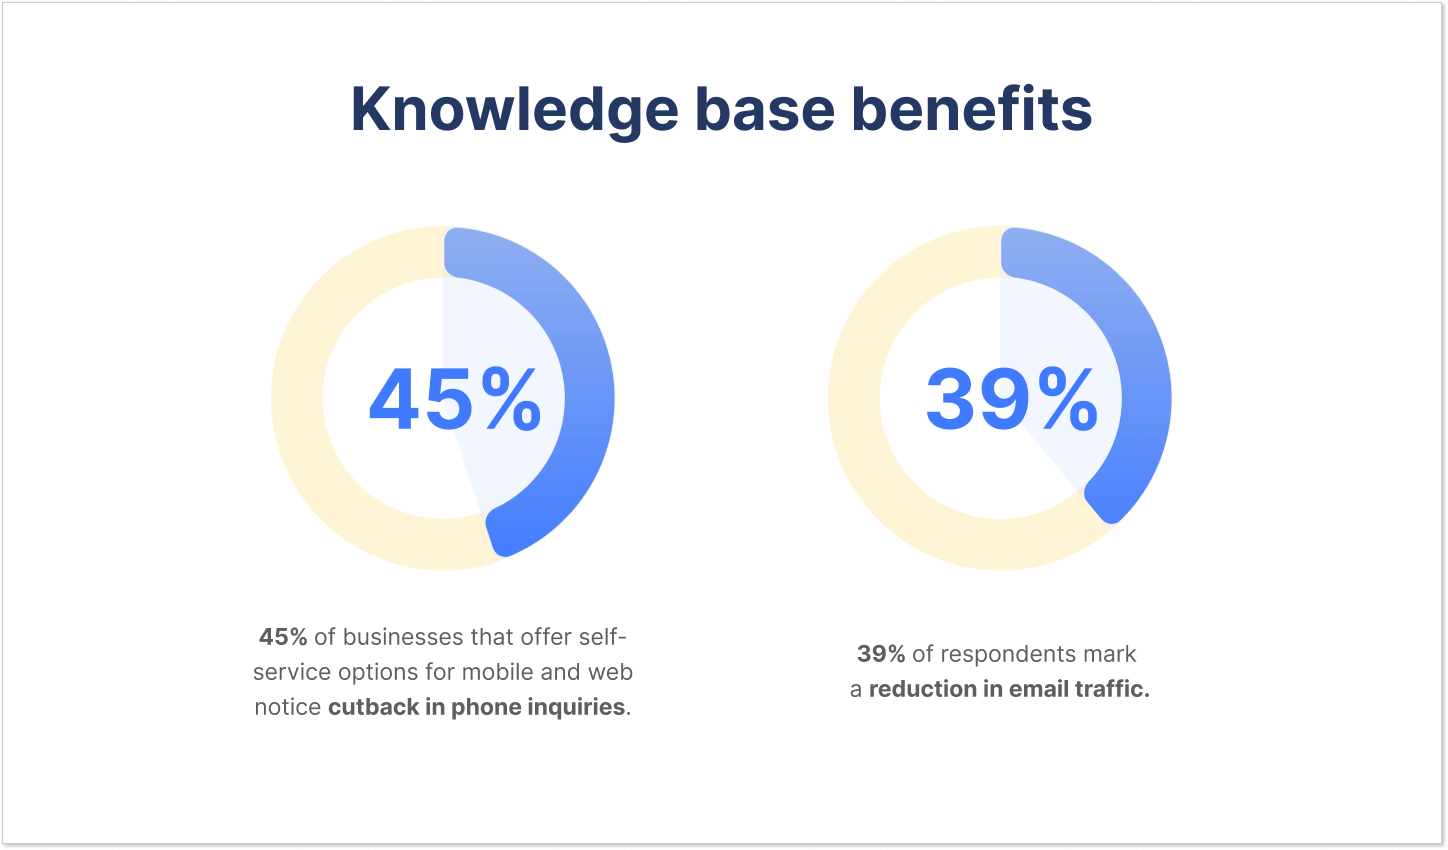
More than 80% of customers use the company’s FAQs and self-service portals, which makes it the most popular customer service channel. Creating a knowledge base and updating it with fresh articles, information, and screenshots should also be a part of the support team’s routine.
The goal is to answer as many questions as possible before people even ask. There are always lots of ideas to write about. Use common questions from your support experience, track niche communities, and Quora.
HelpCrunch also provides the ‘failed searches’ report, where you can instantly see the searches people did in your knowledge base but found nothing. This way, you’ll always have fresh ideas for new articles.
Maintaining a knowledge base and keeping it fresh is a common-sense KPI for customer service representatives. Not only does it save a lot of time, but it also makes them more trained to answer all kinds of tricky questions.
Types of customer service metrics
Let’s walk through some of the most essential metrics to measure the quality of customer service. It just might open your eyes to the areas for improvement and show how satisfied your customers are.
7. Average handle time (AHT)
Benchmark: varies depending on the industry and the specific type of customer interaction. However, a general rule is that AHT should be between 2 and 5 minutes.
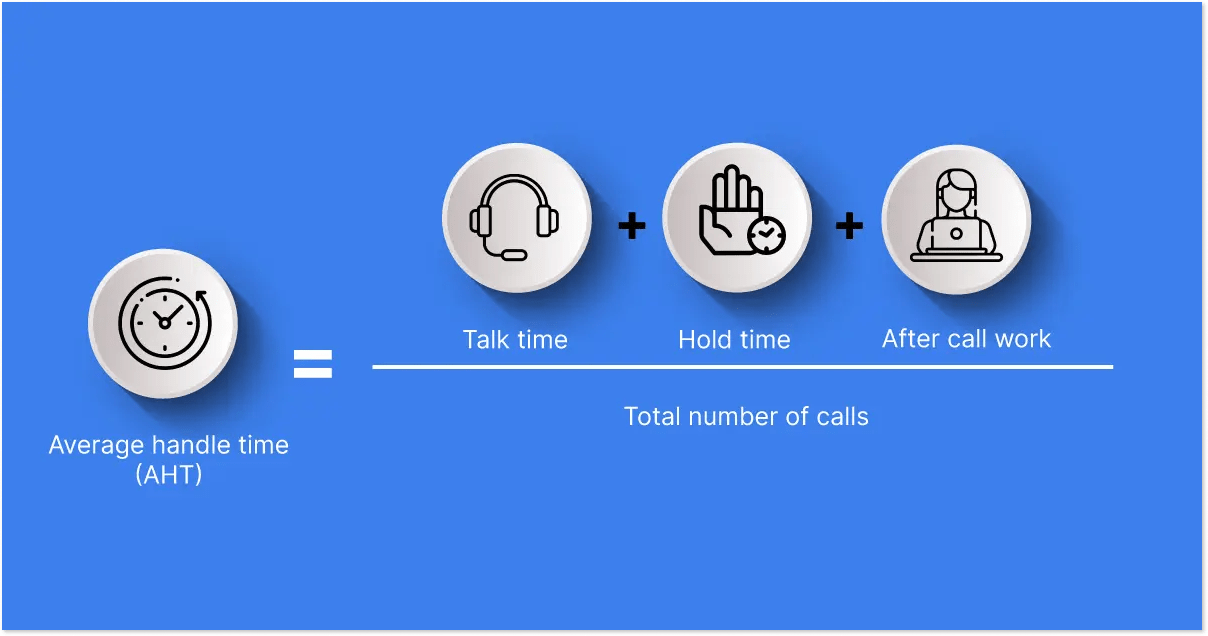
Average handle time (AHT) is a customer service metric that measures the average amount of time it takes to resolve a customer’s inquiry or issue. This includes the time spent talking to the customer, the time spent on hold, and the time spent on any after-call work, such as writing up a report or following up with the customer.
The formula for calculating AHT is:
AHT = (Total talk time + Total hold time + Total after-call work time) / Total number of interactions with customers
While all elements are clear, let me elaborate on the total after-talk work time. It is the time that agents spend on after-call work, such as writing up a report or following up with the customer.
It’s essential to measure average handle time to improve customer service efficiency. Just imagine that by reducing this figure, companies can save money on cost per ticket and enhance satisfaction.
There are a few ways that can reduce AHT and improve the overall user experience:
- Providing agents with training. Well-trained agents can resolve customer issues more quickly and efficiently.
- Using self-service tools. Self-service tools, such as FAQs and online knowledge bases, can help customers resolve their issues themselves without having to contact an agent.
- Using automation. Automation can be used to tackle repetitive questions and follow up with users without a human touch.
- Monitoring AHT. It’s important to monitor AHT regularly to identify trends and areas that require your attention.
8. Contact resolution rate (CRR)
Benchmark: a good CRR should be between 60% and 80%.
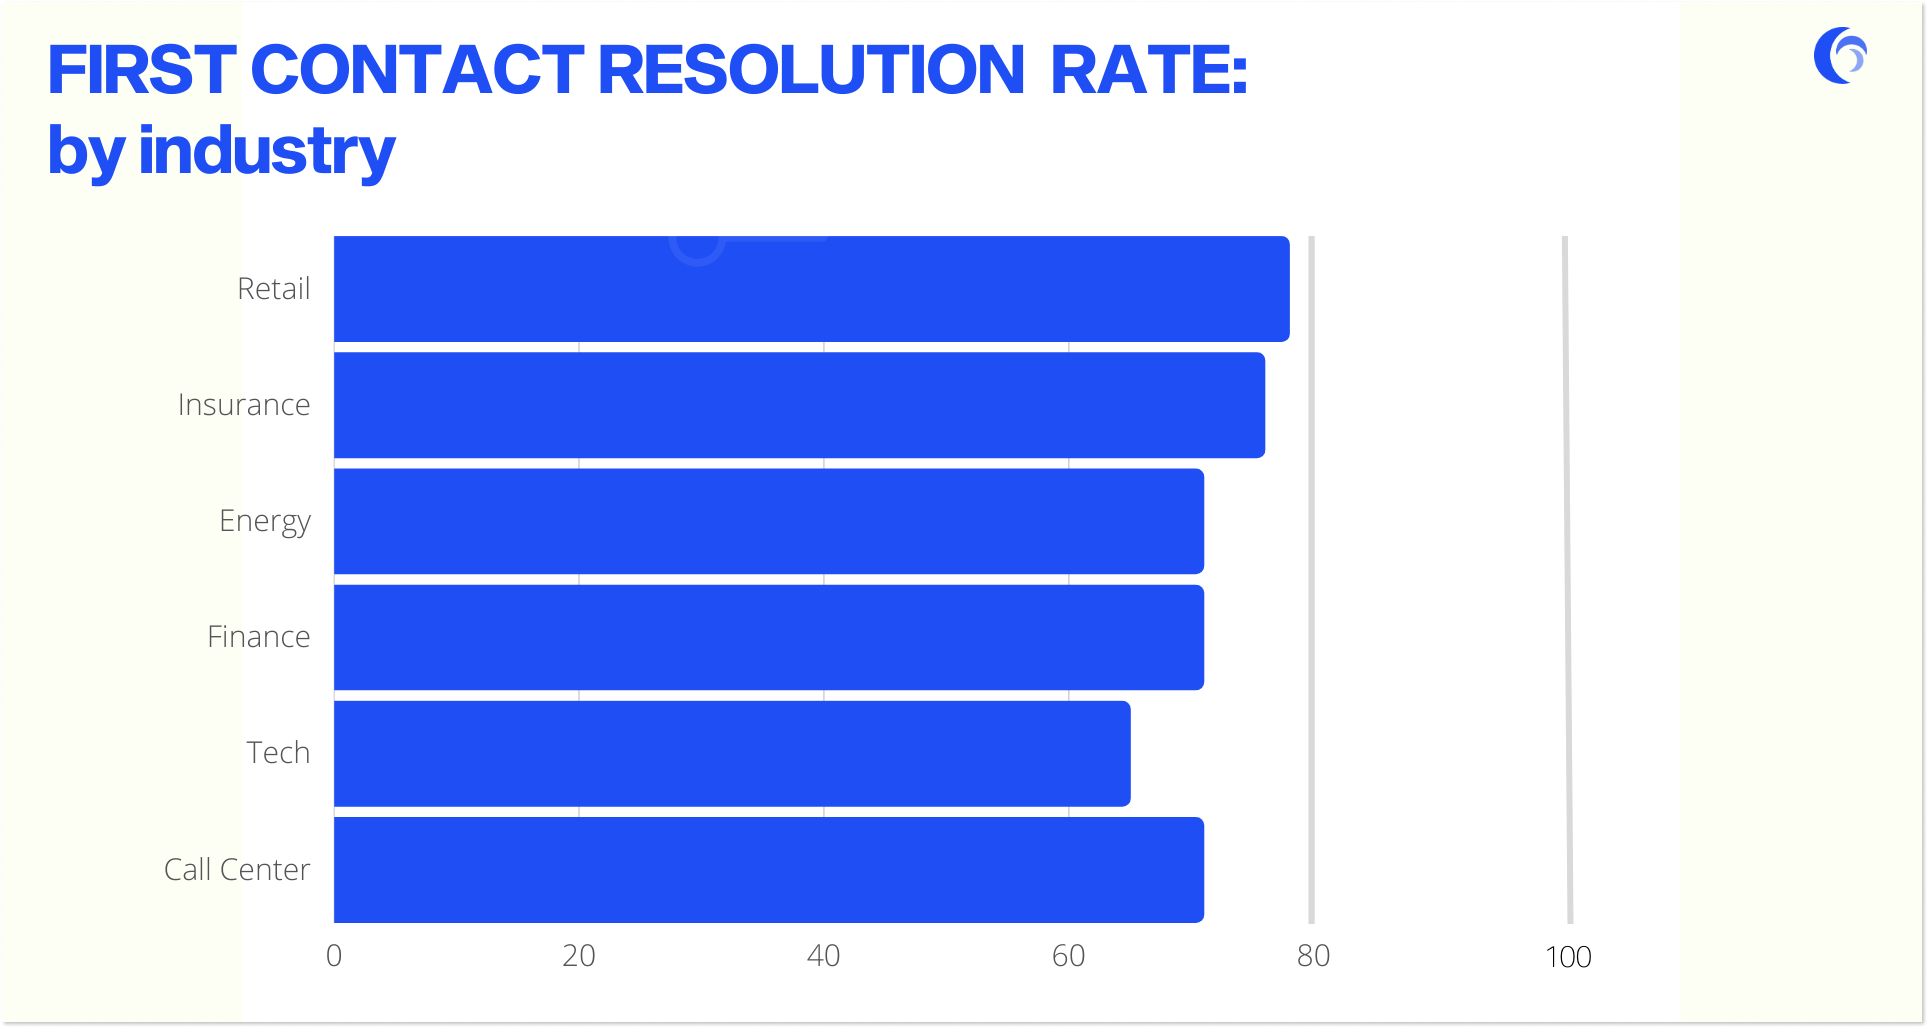
Contact resolution rate (CRR), also known as first-contact resolution (FCR rate), is a customer service critical metric that measures the percentage of customer issues resolved on the first contact. This means that the problem is resolved without the need for any further interaction with the support team.
The formula for calculating CRR is:
CRR = (Number of issues resolved on first contact) / (Total number of customer queries)
A high CRR not only generates happy customers but also gives a lot of other benefits to businesses. It streamlines support operations, reduces costs for labor, and brings to light brand reputation, making you a brand leader.
To cultivate an exceptional CRR, you must continuously improve customer experience and follow strategies that put a client at the center of all decisions.
First and foremost, providing customers with self-service tools, such as FAQs, knowledge bases, and online tutorials, allows them to resolve common issues independently. Additionally, offering multiple communication channels, including phone, email, and live chat, ensures that customers can reach support promptly and through their preferred method.
Customer resolution rate has a direct connection to the level of customer satisfaction and, eventually, business success.
9. Response times
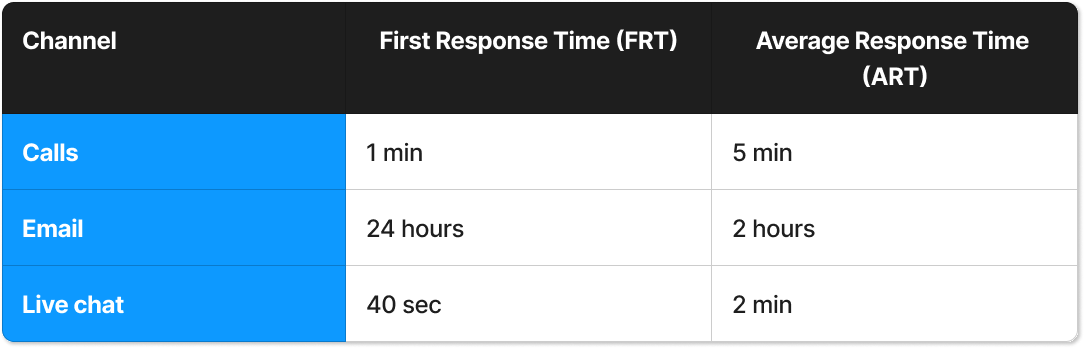
Benchmark: first response time (FRT) should be within 24 hours for email customer support tickets, within 1 minute for phone calls, and 47 seconds for live chat. Average response time (ART) should be within 2 hours for email inquiries, within 5 minutes for phone calls, and 2 minutes for live chat.
Try to provide quick responses, it’s an all-time reliable tactic.
Response times are a measure of how quickly a customer service team responds to user inquiries. There are two main types of response times:
- First response time (FRT) is the time it takes for the customer service team to send an initial response to a customer inquiry.
- Average response time (ART) is the average time it takes to send a response to a customer inquiry.
The formula for calculating FRT is like the following:
FRT = (Total time to respond to first inquiry) / (Total number of inquiries)
The formula for calculating ART is:
ART = (Total response time) / (Total number of inquiries)
For example, a team received 25 requests in a live chat in one hour. The total time to respond to the first message is 30 minutes, and the total response time is 10 hours. The response times for the team would be:
FRT = 30 minutes / 25 = 1.2 minutes
ART = 10 hours / 20 = 24 minutes
You can improve your response times by providing reliable customer support tools for communication. We strongly recommend omnichannel platforms, like HelpCrunch, that can handle any ticket volumes and keep all user inquiries in the same inbox for easy management. Choose a solution that offers automation options like a chatbot, saved responses, and a knowledge base to reduce response time metrics.
If your team is off on weekends, make sure they diligently address the ticket backlog first thing on Mondays to provide timely resolution of customer issues.
Also, remember to set realistic time goals for the agents and monitor their progress.
10. Average time to resolution (ATR)
Benchmark: ATR for phone calls should be within 5 minutes, within 2 hours for email, and 10 minutes for live chat.
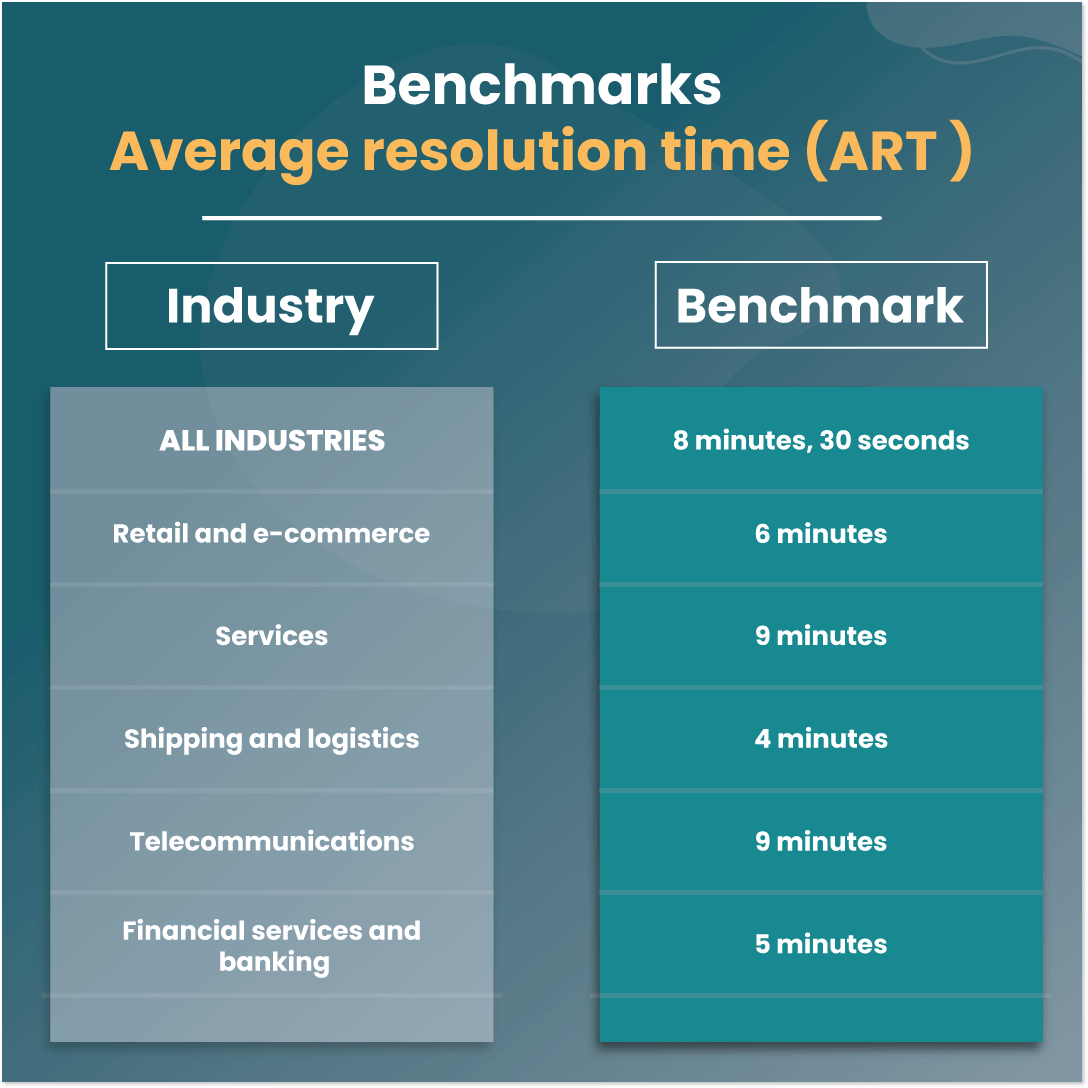
Average time to resolution (ATR) is a customer service metric that measures the average amount of time it takes to resolve a customer inquiry.
The formula for calculating ATR is:
ATR = (Total time to resolve all inquiries) / (Total number of inquiries)
Let’s imagine that customer service managers received 100 unresolved tickets in a day. The total time to solve all the inquiries was 450 minutes. The ATR for the customer support staff would be:
ATR = (450 minutes) / (100 inquiries) = 4.5 minutes
No surprise here that customers are more likely to be satisfied if their issue is resolved quickly. So, by improving this metric, you can make users happier, reduce support costs (quicker resolutions = fewer escalations), and specify the areas for improvement.
How to boost the metric? You need to acknowledge the factors that contribute to prolonged resolution times. Often, lengthy interactions stem from a lack of self-service tools (never tired of highlighting their importance!), insufficient agent training, or poor case management systems. Address these shortcomings to achieve a seamless resolution process.
11. Customer Effort Score (CES)
Benchmark: the average score is 5 out of 7. The average response rate for CES surveys is around 30%. Anything between 15 – 25% is a good response rate and gives you plenty of data to dig into.
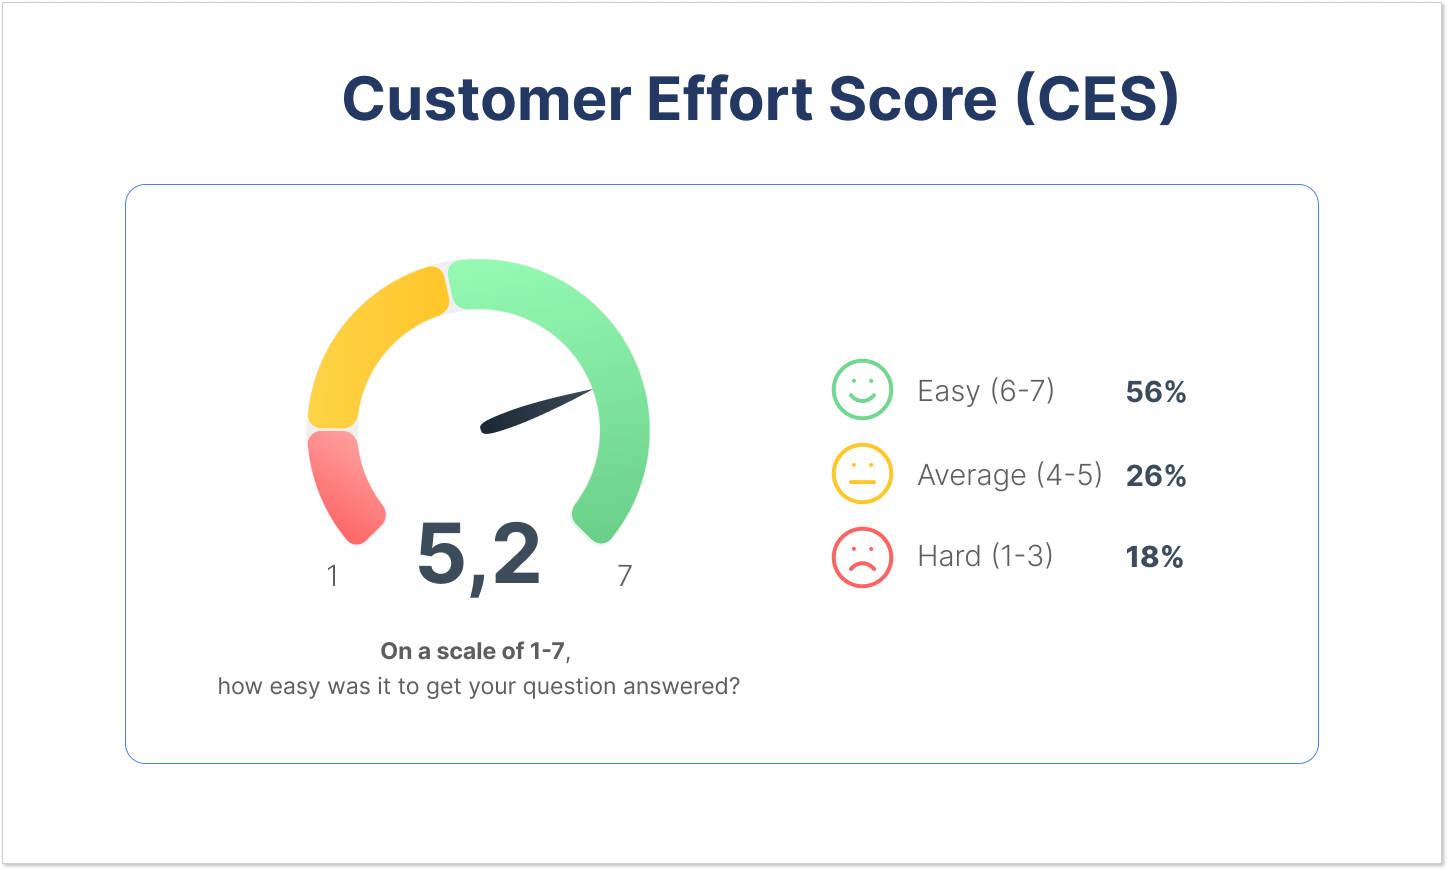
Customer Effort Score (CES) measures how easy it is for a customer to achieve the desired outcome (e.g., resolve their issue, make a purchase, upgrade).
To evaluate the amount of effort people need to apply to contact your support, just send them a post-conversation customer survey with one question: “On a scale of 1-7, how easy was it to get your question answered?” A vote of 5 and higher means that your support is fairly helpful and easy to contact. A score of 1 means that finding it was next to impossible. Basically, the higher your CES score, the better.
The CES score is calculated by finding the average of all responses. Here is the equation:
(Total sum of responses) ÷ (Number of responses) = CES score.
The answers will give you a clear understanding of whether you should improve your UX and reevaluate your design decisions.
If a customer needs to search for your ‘Contact us’ button even for a minute, you’ve failed your mission. Key actions like signing up or contacting support should take zero thought and effort.
The other negative example is when a person is being transferred from one customer service department to another. And no one can give them at least some sort of definitive answer.
12. Customer satisfaction scores (CSAT)
Benchmark: depends on the size, structure, industry, and channel. Here is the average benchmark CSAT per channel:
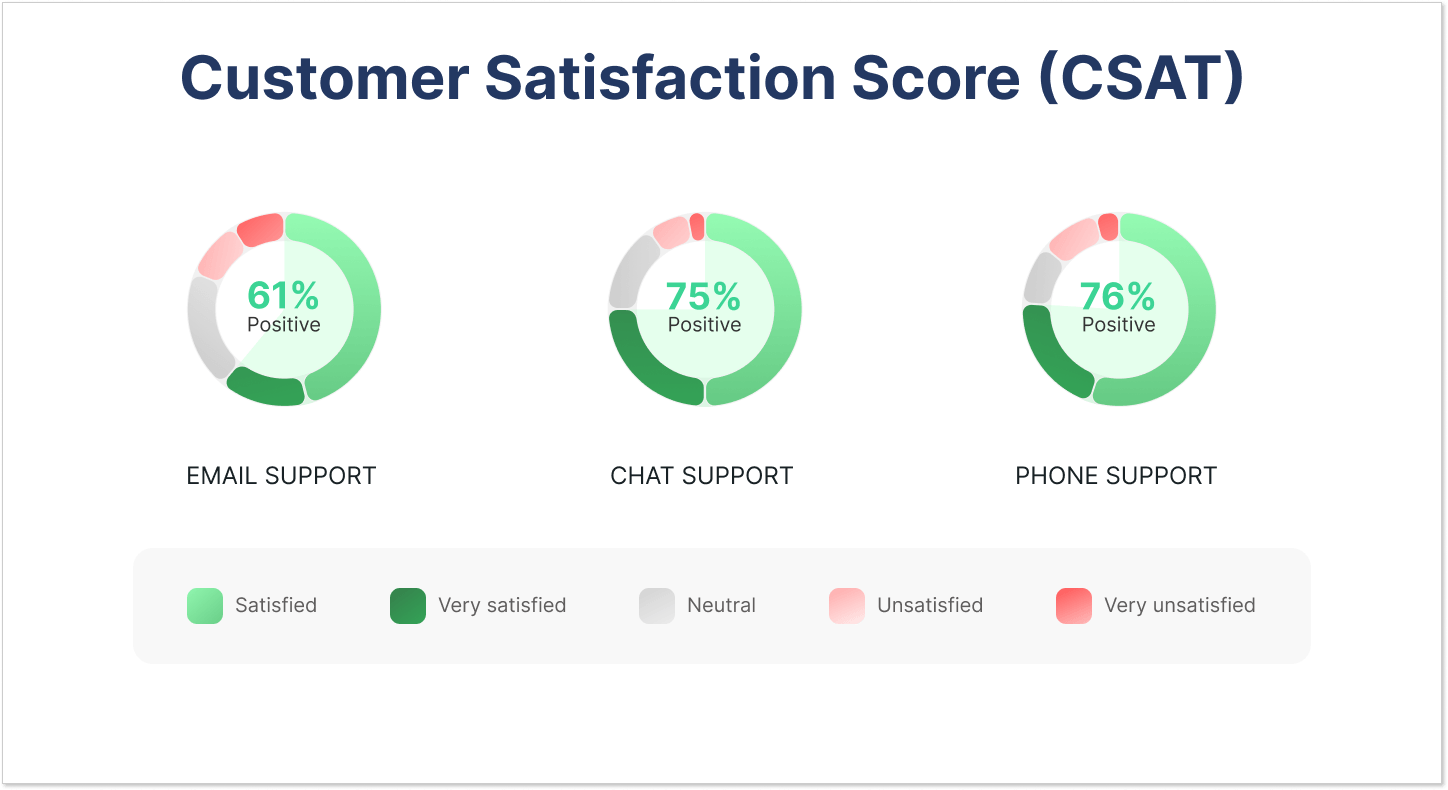
This KPI answers the question “How satisfied are your customers?” There’s no better way to measure it than by directly asking people whether they liked their experience with your business or not.
Just add a simple question at the end of customer conversations and 2-3 answer options to choose from. This will give you all the insight you need.
For instance, you can turn on the ‘chat rating’ option in HelpCrunch. This way, every chat conversation will end with customer satisfaction surveys. For users, it takes just one click to choose one of the three options — poor, average, or great. Customer satisfaction will be measured from 0 to 100% based on these rates, and you will get a full overview of customer perception and clients’ thoughts about your service.
13. Customer retention rate (CRR)
Benchmark: CRR should be between 60% and 80%. For example, for software companies, it’s typically around 70%, while for retail companies, the indicator is around 65%.
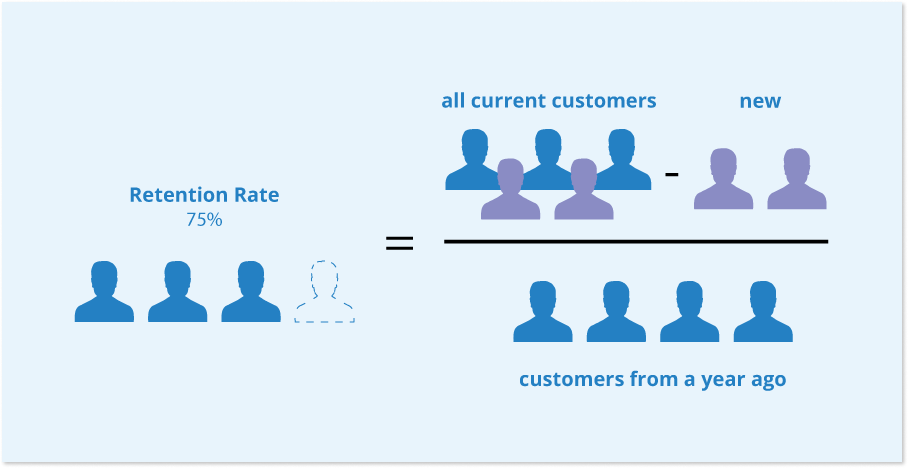
Customer retention rate (CRR) measures the percentage of customers who continue to do business with a company over a specified time period. In other words, it’s a customer lifetime metric.
By tracking this data, you can:
- Reduce customer churn rate. Unhappy customers tend to leave businesses.
- Increase revenue. Satisfied clients are more likely to spend more money with a company.
- Improve profitability. Retaining current customers is typically less expensive than acquiring new customers.
The formula for calculating CRR is:
CRR = [(End of period customers – New customers) / (Start of period customers)] x 100%
For example, let’s say that a company had 250 customers at the specified period of time, like the beginning of the month, and 260 customers at the end of the month (giving us 10 new users). The CRR for the company would be:
CRR = [(260 customers – 10 new customers) / (250 customers)] x 100% = 100%
This would be considered a good CRR, as it is above the benchmark of 60%.
User retention rate isn’t merely about preventing customer churn. Instead, it’s about inspiring strong relationships that result in long-term business growth and profitability.
Offering value-added benefits and incentives can help improve retention. Customer loyalty programs, exclusive discounts, early access to new products or services, and personalized recommendations to each individual customer can demonstrate your appreciation for the users’ loyalty.
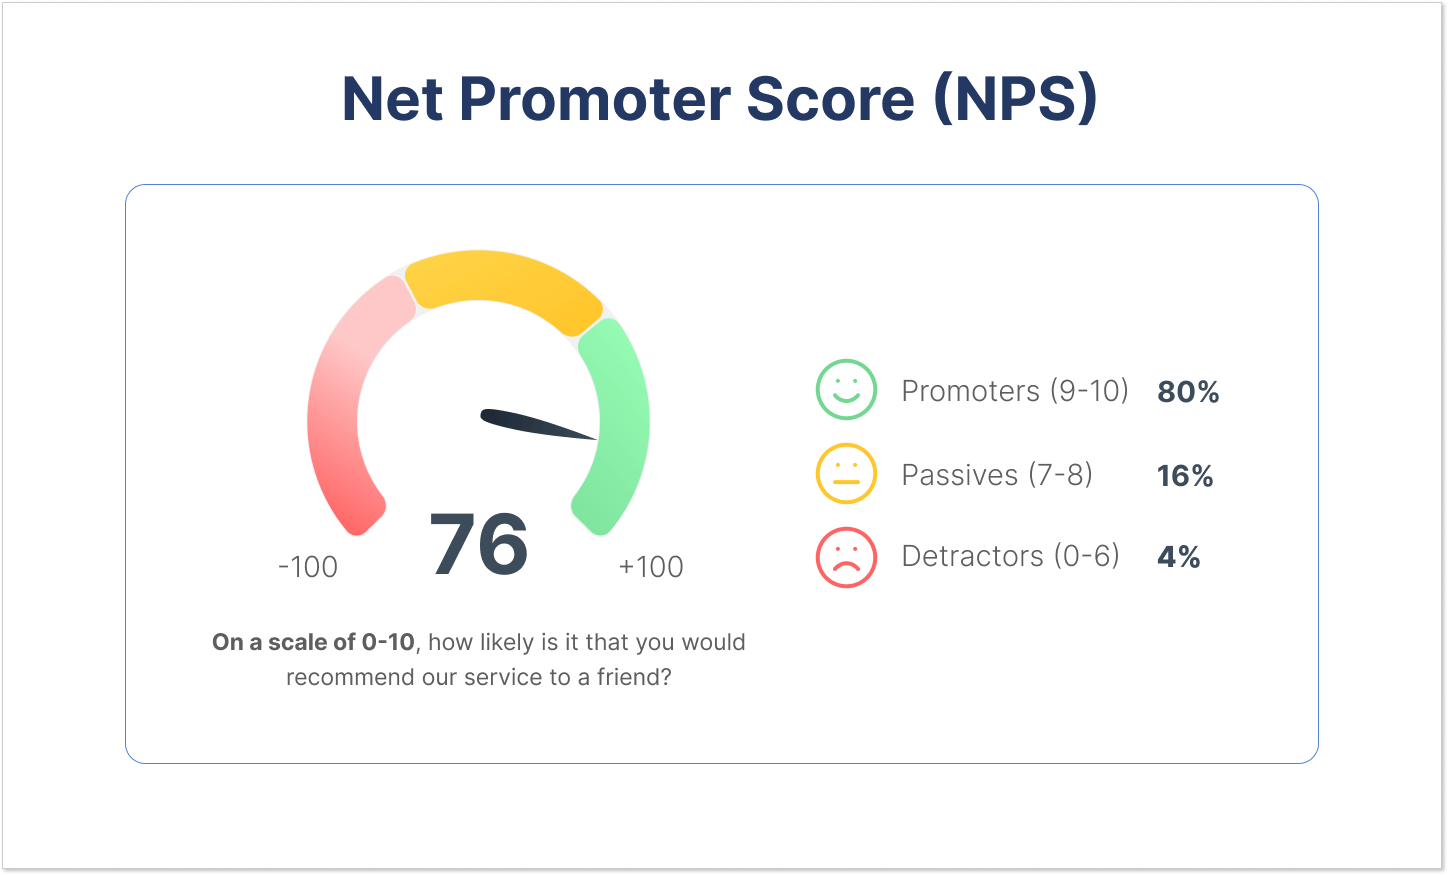
14. Net Promoter Score (NPS)
Benchmark: Depends on the industry, but on average, above 0 – good, above 20 – favorable, above 50 – excellent, above 80 – world-class.
Let me introduce you to the key metric of every business track.
Net Promoter Score (NPS) is one of the most important customer service metrics that measure customer satisfaction and loyalty. It’s based on users’ willingness to recommend your business to other people on a scale of 0-10.
Based on people’s answers, you can break your user base down into three groups:
- 0–6 range (Detractors)
- 7–8 range (Passives)
- 9–10 range (Promoters)
Sounds simple, but it’s an evergreen classic that can tell you more about your customers than you think. For one thing, people who are willing to recommend your brand to their friends and colleagues are one step closer to becoming your brand advocates and ambassadors.
On the other hand, dissatisfied customers can churn any minute, so your customer service strategy should be reviewed and adjusted ASAP.
Your Net Promoter Score is calculated by subtracting the percentage of detractors from the percentage of promoters.
The formula for calculating NPS is:
NPS = Total % of promoters – total % of detractors
Various discounts and loyalty programs are proven ways to retain people who stick with your brand for a prolonged time frame. Without a doubt, customer service plays a crucial role in building trusting relationships. However, it’s virtually impossible to build an effective loyalty and retention strategy without a solid, reliable, and viable product or service.
The importance of measuring and tracking customer service metrics
Being excellent at customer service is like the secret sauce for a company’s success. It’s not just about checking numbers but also building smart strategies that help businesses rock the customer-focused game.
Here are key points proving the importance of customer service metrics measuring:
- Understanding the needs of your customers better
Alright, think of customer service metrics like your business’s secret spy gadgets. They give you insights into how customers enjoy your service, how fast they get help, and if your support team is doing the best they can. It’s like having a crystal ball into what makes your customers happy.
Tracking customer service metrics allows companies to identify patterns and trends and address common issues to improve user experience. This knowledge helps in tailoring products, services, and support to better meet customer expectations and needs. It’s like having a tailor for your business!
- Enhancing your team’s performance and efficiency
Customer service performance metrics help evaluate individual and collective effectiveness. Response times, resolution rates, and customer satisfaction metrics reflect the efficiency of the support team. And what can possibly be more important for business success?
Keeping an ear to the ground helps companies get better. This way, you can focus the training on areas that need improvement. It’s like figuring out your team’s superpowers and where you can be even more effective. If some metrics don’t show good results, having the complete picture helps to come up with a plan and make the whole team shine.
- Improving overall business performance and profitability
Satisfied users are more likely to become loyal customers who contribute significantly to a company’s profitability. By tracking the level of service, businesses can gauge customer satisfaction levels and loyalty, which are key drivers of long-term success.
Positive customer experience leads to increased customer retention, reduced churn, and positive word-of-mouth referrals. Moreover, addressing customer concerns promptly and effectively allows companies to diminish the risk of negative reviews and reputation damage, which can have a direct impact on profitability.
Wrap up
While each customer service KPI and metric is important, measuring all of them at once might be frustrating for a novice. If that’s the case, start with tracking the most crucial one: customer satisfaction rate. It’s a fundamental indicator that helps you test the waters and see how people feel about your business in general, not just its customer service.
You can get satisfaction reports within the HelpCrunch platform. It also provides the tools essential for great customer service, like live chat, knowledge base, popup editor, and email automation. Sign up for a free trial and see how your business can benefit from it.