11 Cardinal Live Chat Metrics: Do You REALLY Monitor Them?
Do you actually gauge all the main chat metrics? They are not limited to just the total number of chats, by the way. We explain what they are and how to measure them in our new material. Let's get the ball rolling!
Written by Olesia Melnichenko

Would an astronaut be successful in their space flight without monitoring all the spaceship’s characteristics? 👩🚀 If there’s a teeny-tiny bolt missing, the astronaut won’t be able to see if the machine is up and running, the cabin atmosphere and air quality could deteriorate, putting the astronaut’s health in danger. Consequently, it may even lead to death.
Just like the astronaut, you should keep close tabs on the “spacecraft”, that is your business. It’s you who is motivated to check its progress and performance along the way. In a word, to see if the business runs like a well-oiled machine.
The way you communicate with customers and the data you gather can make it or break it. The latter is possible to implement via live chat. If you can’t wait any longer, read on! We present live chat performance metrics that you should gauge and set benchmarks for success. So, let’s not futzing around!
General live chat metrics
We start with some common live chat metrics that could help you check the number of dialogues your team has over certain time frames:
1. Total number of chats
On the face of it, this metric might seem self-explanatory. But as we dig deeper, it’s not that simple. The total number of chats is the total queries your team receives in a time span – say, a day, a week, or a month.
First, you should establish your own business benchmark, that is what amount of chats are OK for you. Then, if the average number of missed chats drops, think of the reasons for that (seasonal, new bugs, newcomers in the audience, knowledge base update, etc.).
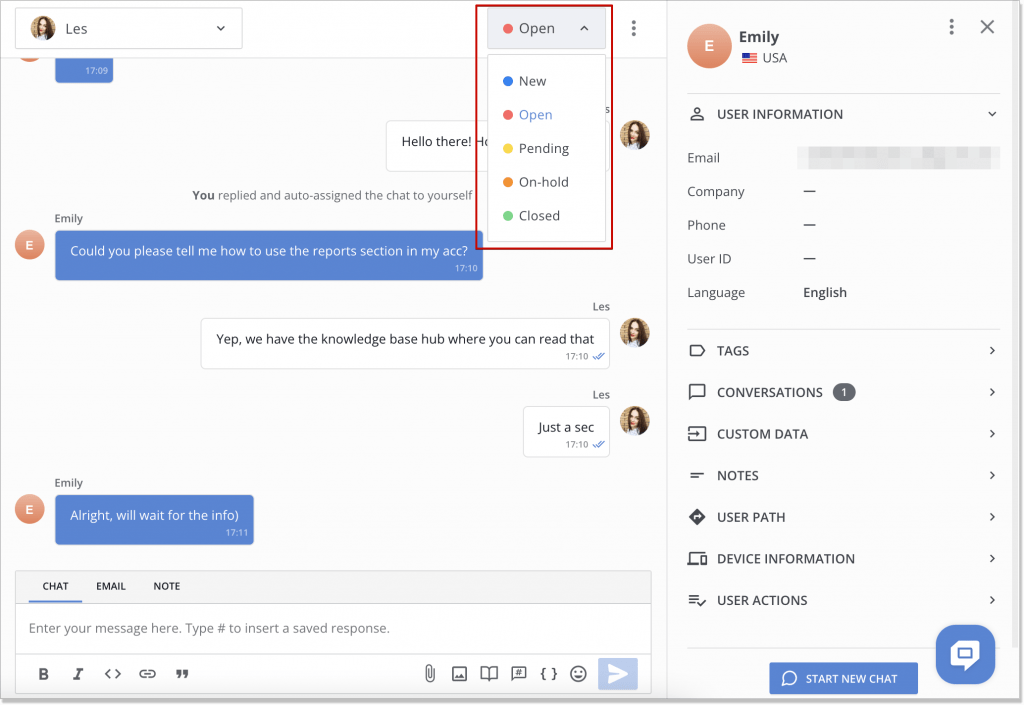
To better understand the total number of chats, make sure your software allows live chats division into such groups or alike: New, Open, Pending, On-hold, and Closed. This way, you can omit the mayhem in the Inbox and build a more structured workflow. See how HelpCrunch – a full-house customer communication platform – lets you do just that:
Should you panic if the total number of chats is low? Just a smudge (I am kidding, though). Being a little less flippant, such a situation may indicate a couple of things: 1) your chat with us button is hard to find on a website, or 2) customers prefer another communication channel.
If it’s number one, try to place the button in plain view (e.g. at the lower right-hand corner) or on a completely different page (e.g. a product feature page). I guess your moves are clear if it’s number two, but let me give you a hint though: add another communication channel your audience enjoys better. For instance, if you have just a live chat, go omnichannel – have Telegram, Facebook, or Instagram integrations.
📌Short hint: To improve the number of chats, you should always monitor the sudden drops or rises and react to them respectively. That is why checking it on a daily basis may come in handy. Plus, see if you have enough staff to cover all the messages throughout the day. Otherwise, you will witness mass quitting and customers waving goodbye.
2. Finished chats
This metric might be thought of as an extension of the previous one. Finished chats are simply the number of chats your team has already closed in a specific time period. The “finishing” fact usually refers to a dialogue being accepted by a chat agent and marked as “Closed” by them or a customer.
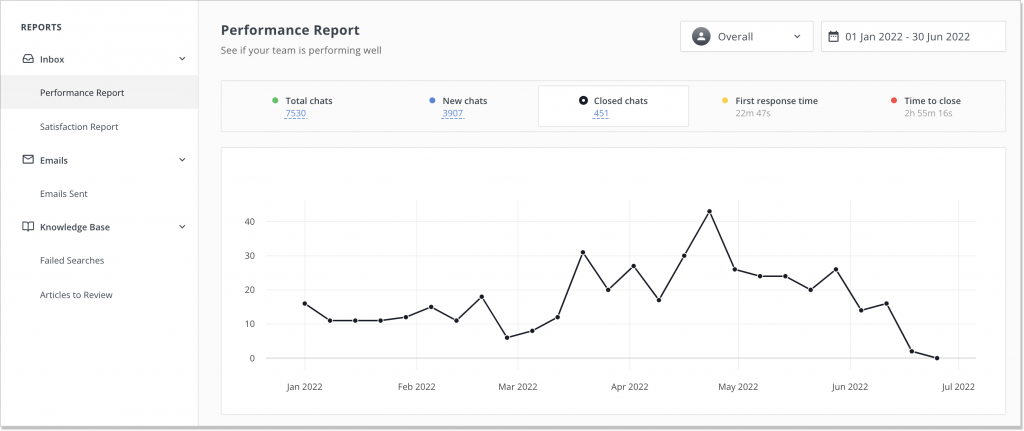
Thanks to the latest software, you don’t have to reinvent the wheel to track live chat metrics. If you’re an active user of HelpCrunch, you can easily monitor closed chats by looking them up in the Reports → Performance Report section. It’s also possible to check either the overall team progress or choose a specific support agent as well as a period of time.
3. Chat to conversion rate
How is it possible to check chat support metrics without keeping close tabs on conversions? Chat to conversion rate is a metric ideal for your live chat lead generation activities. It shows the total number of people who converted after they had a conversation with the business. Just check the figures: 38% of people say they end up making a purchase from a brand after they have a little talk with it.
How should we interpret conversion? – one might ask. Well, it may not be the same for a toy store and a gym club, for that matter. Everything hangs upon your brand’s goals. It can be a sign-up to a newsletter/webinar, a purchase, or a gym membership.
📌 Short hint: To ace this metric for live chat and make customers convert faster, you need an action plan. Fortunately, I’ve just come up with one for you:
- Show your customer support squad how to be proactive and build special emotional bond with the audience (especially with returning customers)
- Trigger personalized welcome messages on your website to greet and seat customers
- Take advantage of a chatbot to qualify leads like a pro, ask direct questions, and then transfer a lead to a sales team
- Teach staff how to upsell and cross-sell
- Educate your support team with knowledge base articles they might need while interacting with a client and handling a query
4. Missed chats
Yeah, a not-so-pleasant live chat metric. However, it still needs to be gauged. Missed chats show the number of chats your support team left without any attendance. To put it in a nutshell, missed chats are about unseized opportunities and the result of customer engagement.
One of the pillars here is business availability: how easy (or not) clients can reach out and if there are enough agents to handle the queries. According to the stats by Inc, 51% of customers claim that a business should be available 24/7 no matter what. Do you see that your Inbox loses piles of chats? Time you bit the bullet and expand your team!
📌 Short hint: How to change the situation for the better? One of the surefire ways would be to install an FAQ chatbot and have it answer customers’ questions. This way, you can split the workload equally between the robot and the human part of the team. At least have it deal with customer FAQs on some basic issues.
Live chat metrics measured in conversations
Now, we’re getting to the main part: how you measure triumph in conversations. What actions to take when you see a gap and how to check if a customer isn’t bored while waiting for their turn? It’s all here 👇🏻
5. First response time (FRT)
First response time is the time between a question asked by a customer and a reply sent by a customer support agent. From my perspective, this chat metric should be at the top of your list to measure. Because live chat implies instant communication and crisp reaction.
What benchmark should you take a cue from? Here comes the “unexpected” – each customer communication channel has its own FRT target reference point. But today we’re focusing on live chat. According to the numbers, the average FRT for this channel wavers between 46 and 48 seconds.
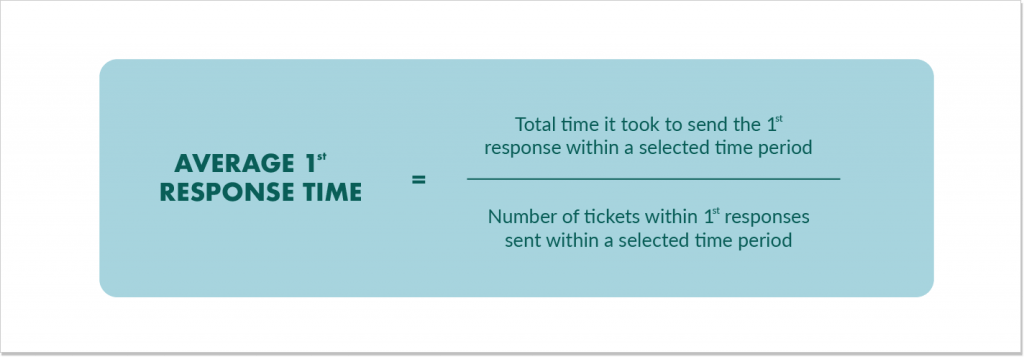
To keep an eye on the FRT in HelpCrunch, you can just navigate to the Reports → Performance Report → First response time. If you want to manually calculate the FRT for your team, take the total time it took to send the first response over a certain period of time and divide it to the number of tickets sent along with it:
📌Short hint: When the FRT is high, be sure to see your audience really nervous. Here are some hacks for you to take the heat down a little:
- Create and send canned responses beforehand to save loads of time
- Use ticket auto-routing to a certain agent or a department based on what a user requires
- Take advantage of a chatbot that shares knowledge base links, sends saved responses, and caters to clients’ demands
6. Average customer wait time
I am the kind of person who seats on the edge of the chair when talking to a bank officer or awaiting my turn at the doctor’s. And I am not alone! 24% of customers say long waiting times are frustrating. Duh!
Always keep your finger on the pulse and track customer wait time – the live chat metric represents how long a client has to wait for a reply on average. Don’t mix it with the FRT – they’re alike but have slight differences. While customer wait time is about the periods a client spends in New, Open, or On-hold statuses, the FRT is the time between the ticket creation and the first agent’s reply to a customer.
To calculate it and see if you’re OK, here is a simple formula:
Average Chats Response Time = [Total time passed until a chat reply was sent] / [Number of Chats]
What about some benchmarks? There is one! The rule of thumb is that the average customer wait time should be 2 minutes and 40 seconds. So if you see that your team makes the audience wait for the sun to shine, time to take steps.
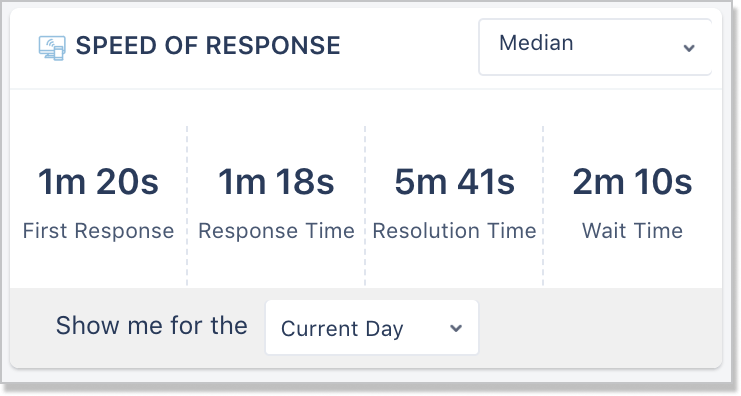
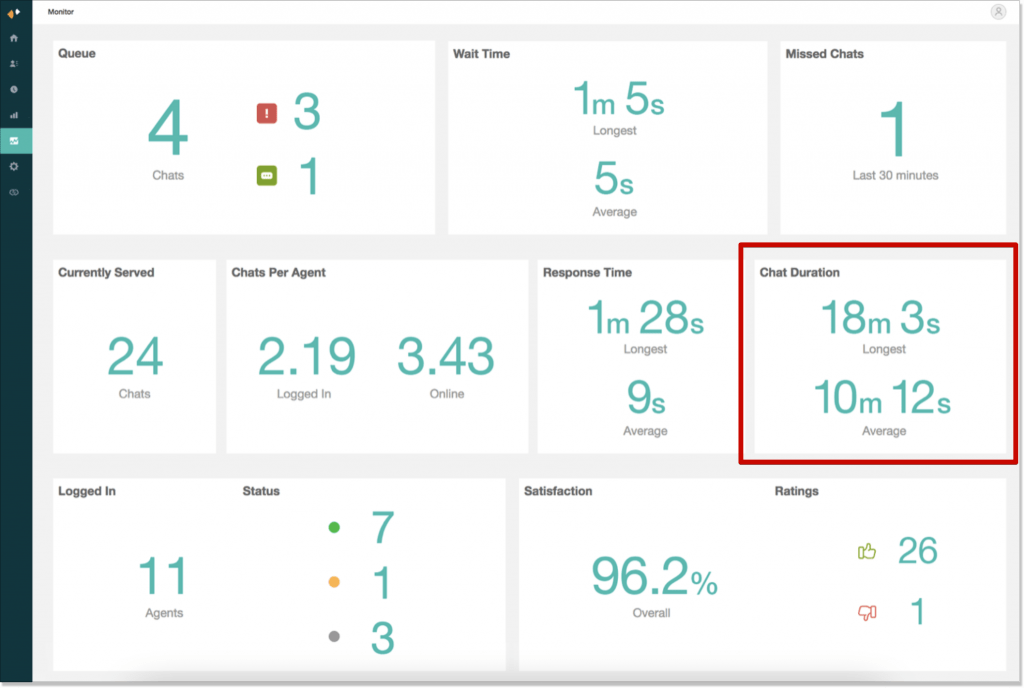
Almost every modern live chat software allows you to monitor average customer wait time. Generally, this info can be found in the Settings section. Here is an example of how this metric is shown along with other chat indicators in the dashboard:
7. Average chat duration
Of all chat metrics, this one is the most tricky, I would say. It defines the overall amount of time between the moment a chat started and the moment it’s closed either by a customer or a support agent. And as you can guess, this time can vary.
Most stats say that the average chat duration for live chat conversations is 11 min and 15 secs. According to some other statistics, 77% of customers claim that valuing their time is the most important thing a brand could do when delivering good customer service. So, the less time it takes to solve the issue, the better.
The modern software offers the opportunity to control the chat duration in the dashboard. In most cases, this info is hidden in the Settings or Reports section:
Before you start acting on a long chat duration time, make sure you understand what may lead to this problem. Off the top of my head, there could be at least three poor aspects:
- Agents’ soft skills – they fail to manage complex issues and communicate with clients appropriately;
- Customers’ communication skills – a client could feel like they have no correct words to explain the issue;
- Access to information – a support team could simply lack decent access to helpful resources to assist customers.
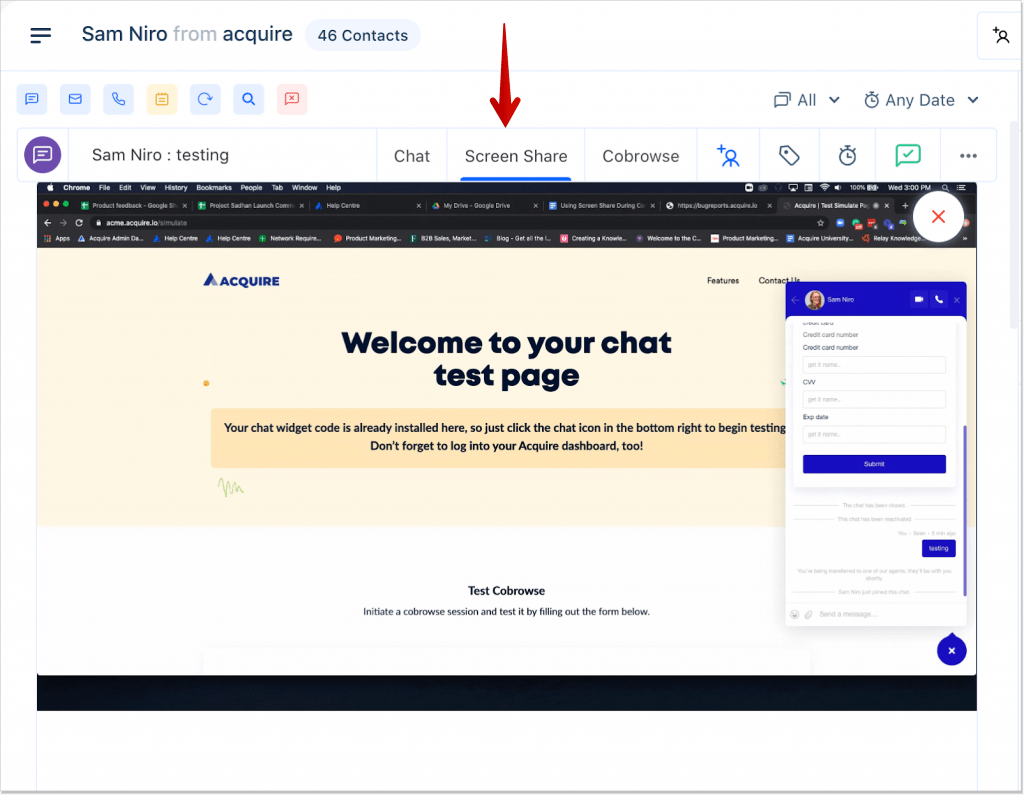
📌 Short hint: Not to elongate the chat duration, first identify what topics are blocking the whole conversation flow. Then, consider sharing explanatory materials such as video tutorials with a client or use a screen-sharing feature to immediately see what the problem customers are facing. This is what it could look like:
Agent’s performance live chat metrics
Last but not least – the chat customer service metrics are connected to the agent’s performance. These should be paid your highest attention to:
8. Customer satisfaction score (CSAT)
This chat metric should be pinned on the agent’s desk and checked day by day. Its interpretation is simple: CSAT shows how satisfied the audience is with a product or service. In our case, you have to measure how pleased clients are with live chat conversations.
As for the CSAT benchmarks, it varies from industry to industry. For instance, a good CSAT for banking is 78%. Compare it to 72% with that of Internet social media.
Why the CSAT score could be low? Here are a few reasons, so align them with your business:
- The FRT is high
- Agents don’t have enough product expertise
- Agents can’t find the right solution to customers’ problems
- Agents get antsy
You can identify the CSAT score by asking a customer direct questions in your live chat dialogue or sending CSAT surveys. For instance: How would you describe your overall experience with our company? And then you provide the scale from 1 to 5, with 1 being “very unsatisfied” and 5 – “very satisfied”.
After that, you can extract the CSAT score in %! Only answers with 4 and 5 can take part in the calculation because these are the highest values for customer feedback and retention. So, here’s the formula to leverage:
(Number of satisfied customers (4 and 5)/ Number of survey responses) x 100 = % of satisfied customers
For instance, if you have 235 satisfied customers (with 4 and 5’s) and 316 people surveyed in total, the CSAT score is 74% of satisfied customers.
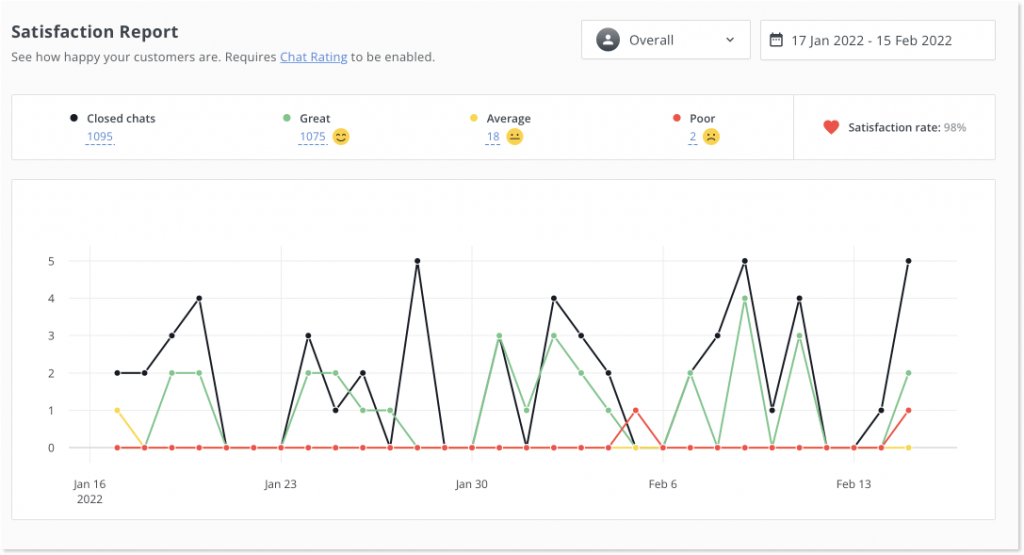
How do we at HelpCrunch track customer satisfaction? Once the chat is finished, an agent sends a chat rating survey, where a client can choose how they’re pleased with the service. Then, we can go to the Reports → Satisfaction report section, filter the date period, and see how the team is performing:
📌 Short hint: To better the CSAT, think of using any of these pieces of advice:
- Respond quickly (canned responses could help here)
- Deliver on your promises (if you say the devs team will fix the issue in two-day time, make sure they do that)
- Follow-up even after the deal is sealed
- Use a friendly manner of communication
9. Average resolution time (ART)
Average resolution time (aka average handle time) is one of the key agent productivity metrics for chat no matter the channel. The ART refers to the average time a support agent takes to solve an issue.
It depends on so many things, beginning with the industry and ending with the type of the customer’s issue or agent’s qualification. To back up my words, here is the ART benchmark for different niches:
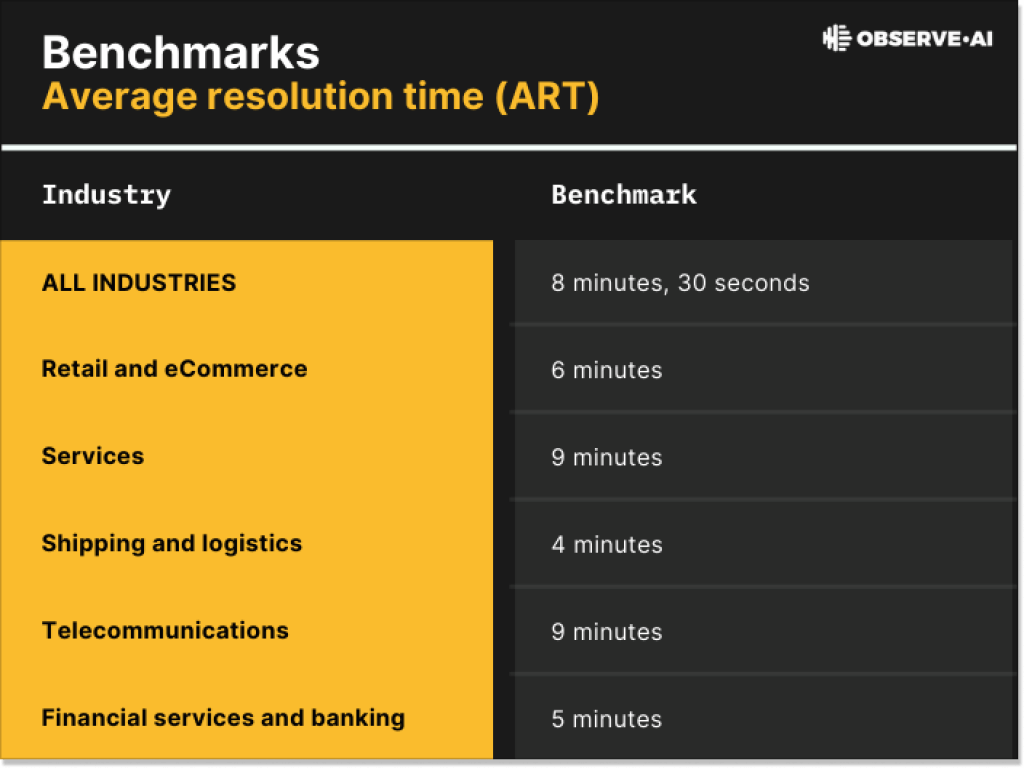
As a matter of fact, the ART is tied to your support reps’ skills because providing a quick answer is half the battle. The point is how long it takes them to resolve the issue. So the lower ART is, the better (the guys from the shipping and logistics industry could now show off a little!). However, you shouldn’t let the dice roll.
Of course, you can rely on the machine and software to do the math. If you’re an old-fashioned kind of person, though, figure out the ART manually with this plain formula:
Average resolution time = Total number of resolved chats / The total number of chats
📌Short hint: The easiest way to affect the ART and keep it low is to constantly train your team how to be pros, encourage them to visit masterclasses, and watch educational videos, to name a few. Plus, teach your staff de-escalation techniques, show what empathy looks like, and update the internal knowledge base (if you have one).
10. Net Promoter Score (NPS)
Net Promoter Score measures the likeliness of customers to recommend your product or service to others. NPS is equivalent to a word-of-mouth tactic in a way – it helps measure how much people are ready to share stuff about your organization with their family and friends (good or bad). The higher the NPS, the more brand advocates you get.
Normally, NPS would be measured using a scale from 0 to 10 and asking one simple question after you finish chatting – How likely are you to recommend us to others? Respondents will be divided into these groups:
- Detractors – customers with scores from 0 to 6 who express their dissatisfaction
- Passives – customers with scores 7 and 8 who may not recommend you to others
- Promoters – customers with scores 9 and 10 who are really likely to recommend your company to others
Calculating this chat metric is the walk in the park: subtract the percentage of detractors from the percentage of promoters. For instance, if 10% of customers are detractors, 20% are passives and 70% are promoters, your NPS score would be 70-10 = 60.
📌Short hint: You want to receive more promoters, no doubt. Here is a friendly pointer – don’t shrug off the chat rules online in customer communications, and follow-up with detractors to know how to make it up to them.
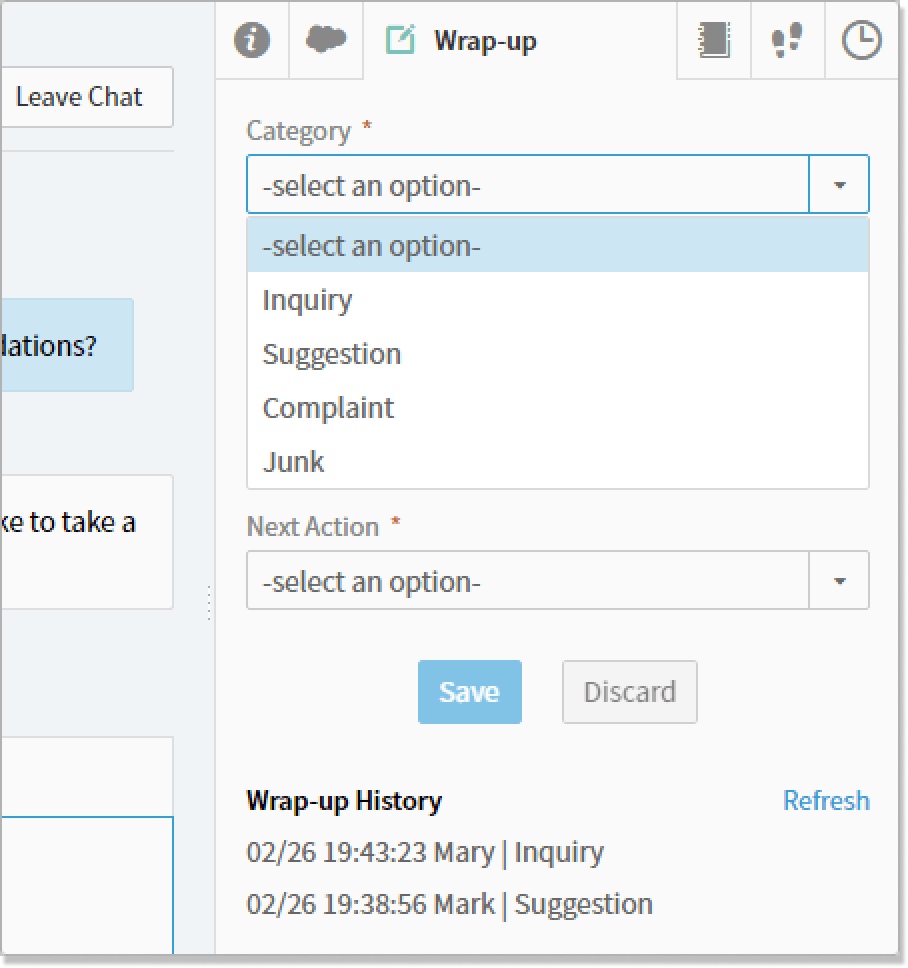
11. Wrap-up time
When a chat is over, it doesn’t mean the work has been done for good. A customer support rep has lots of work afterward. This is what the wrap-up time is all about.
The functionality is common in call-centers but most live chat solutions provide a wrap-up feature, too. It could help you sort out all the post-chat info at the end of the dialogue. You just add the following contextual details:
- Total communication time
- Agent’s name
- The reasons for complaint
- The solution
- Other notes about your dialogue
The wake-up call could be a really long wrap-up period. It could be affected by the agent’s skills, the issue complexity, data entry requirements, etc. To calculate it, just measure the amount of time that it takes to solve one problem and switch to the next one:
Wrap-up time = Handle time – (hold time + talk time)
*Handle time = from the moment a customer is connected to the chat till the moment they are disconnected
* Hold time = brief times when an agent puts a chat on-hold
* Talk time = most productive moments of the chat
📌 Short hint: Keep the wrap-up time as short as possible. Complete some info processing during the chat, establish a clear wrap-up procedure (if you’re a business owner), improve your typing skills, and integrate your live chat with a CRM for streamlining the whole process.
Sum it up
When all is said and done, step into the game. No one expects you to track all of these chat metrics at once. However, you still have to identify the most important ones and stick to them.
If I were to gauge my live chat performance, I would definitely take chat to conversion rate, first response time, CSAT, and time to close into consideration. But your business is a whole new ball game.
To measure a live chat’s success, you should have a live chat, obviously. And if you want to monitor its metrics hassle-free, you’d better choose a platform that allows you to do that automatically. Why don’t you test the waters with HelpCrunch? Sign up for a free 14-day trial, communicate with your customers, and see how you make the grade.