8 Most Essential User Engagement Metrics to Measure
Make sure you catch up with your clients the right way. Tracking essential customer engagement metrics is what it takes. Check out 8 all-important criteria here.
Written by Olesia Melnichenko

We all want to be the focus of clients’ attention. That’s the name of the game. You see, everything is related. The better your bottom line is, the more customers you are going to see in your client base. And the main thing needed to stay in the limelight is keeping customers as engaged as possible.
Now, what do marketers usually undertake to strike a chord with people? Everything from being active on social media, nurturing trial period clients, or creating tailored content that addresses clients’ needs goes into the battle. Think of the most preferable way for your business to quench the customers’ hunger for your product.
To be in-tune with what your users like and don’t like, you should anticipate changes and look at all potential scenarios. Your team’s eyes should be on one thing: customer engagement metrics. So, here it goes.
What is customer engagement?
User engagement is when your customer is realizing value from your SaaS.
Lincoln Murphy
Customer engagement implies a special interconnection between a business and a client and the way it’s established. This relationship is usually aimed at encouraging loyalty, boosting client satisfaction, and increasing their awareness.
Engaged customers are more open to your offers and marketing activities. They may even pay less attention to some glitches in your system. Thanks to their trust in your business, everything else takes a back seat.
Besides, if you engage clients instantly, they are more prone to spend more money on your product or service than they do on your competitors. Judge by yourself. Highly-motivated clients brought 37% more revenue in the banking industry than those who weren’t.
All in all, everything comes down to one conclusion: engaged means loyal. Don’t take my word for it. Just check out customer engagement examples and you’ll see what this is all about.
OK, the big question is on the line: How to measure customer engagement? Well, this is our next stop here.
8 important customer engagement metrics to track
To measure customer engagement and get a bird-eye-view of how users interact with your brand, you should be alert to certain metrics. Besides, this endeavor is deeply associated with online presence success. So, let’s cut to the chase here:
1. Net Promoter Score
Net Promoter Score (NPS) is all about customer loyalty. It determines whether your clients are likely to spread the word about your company and how happy they are.
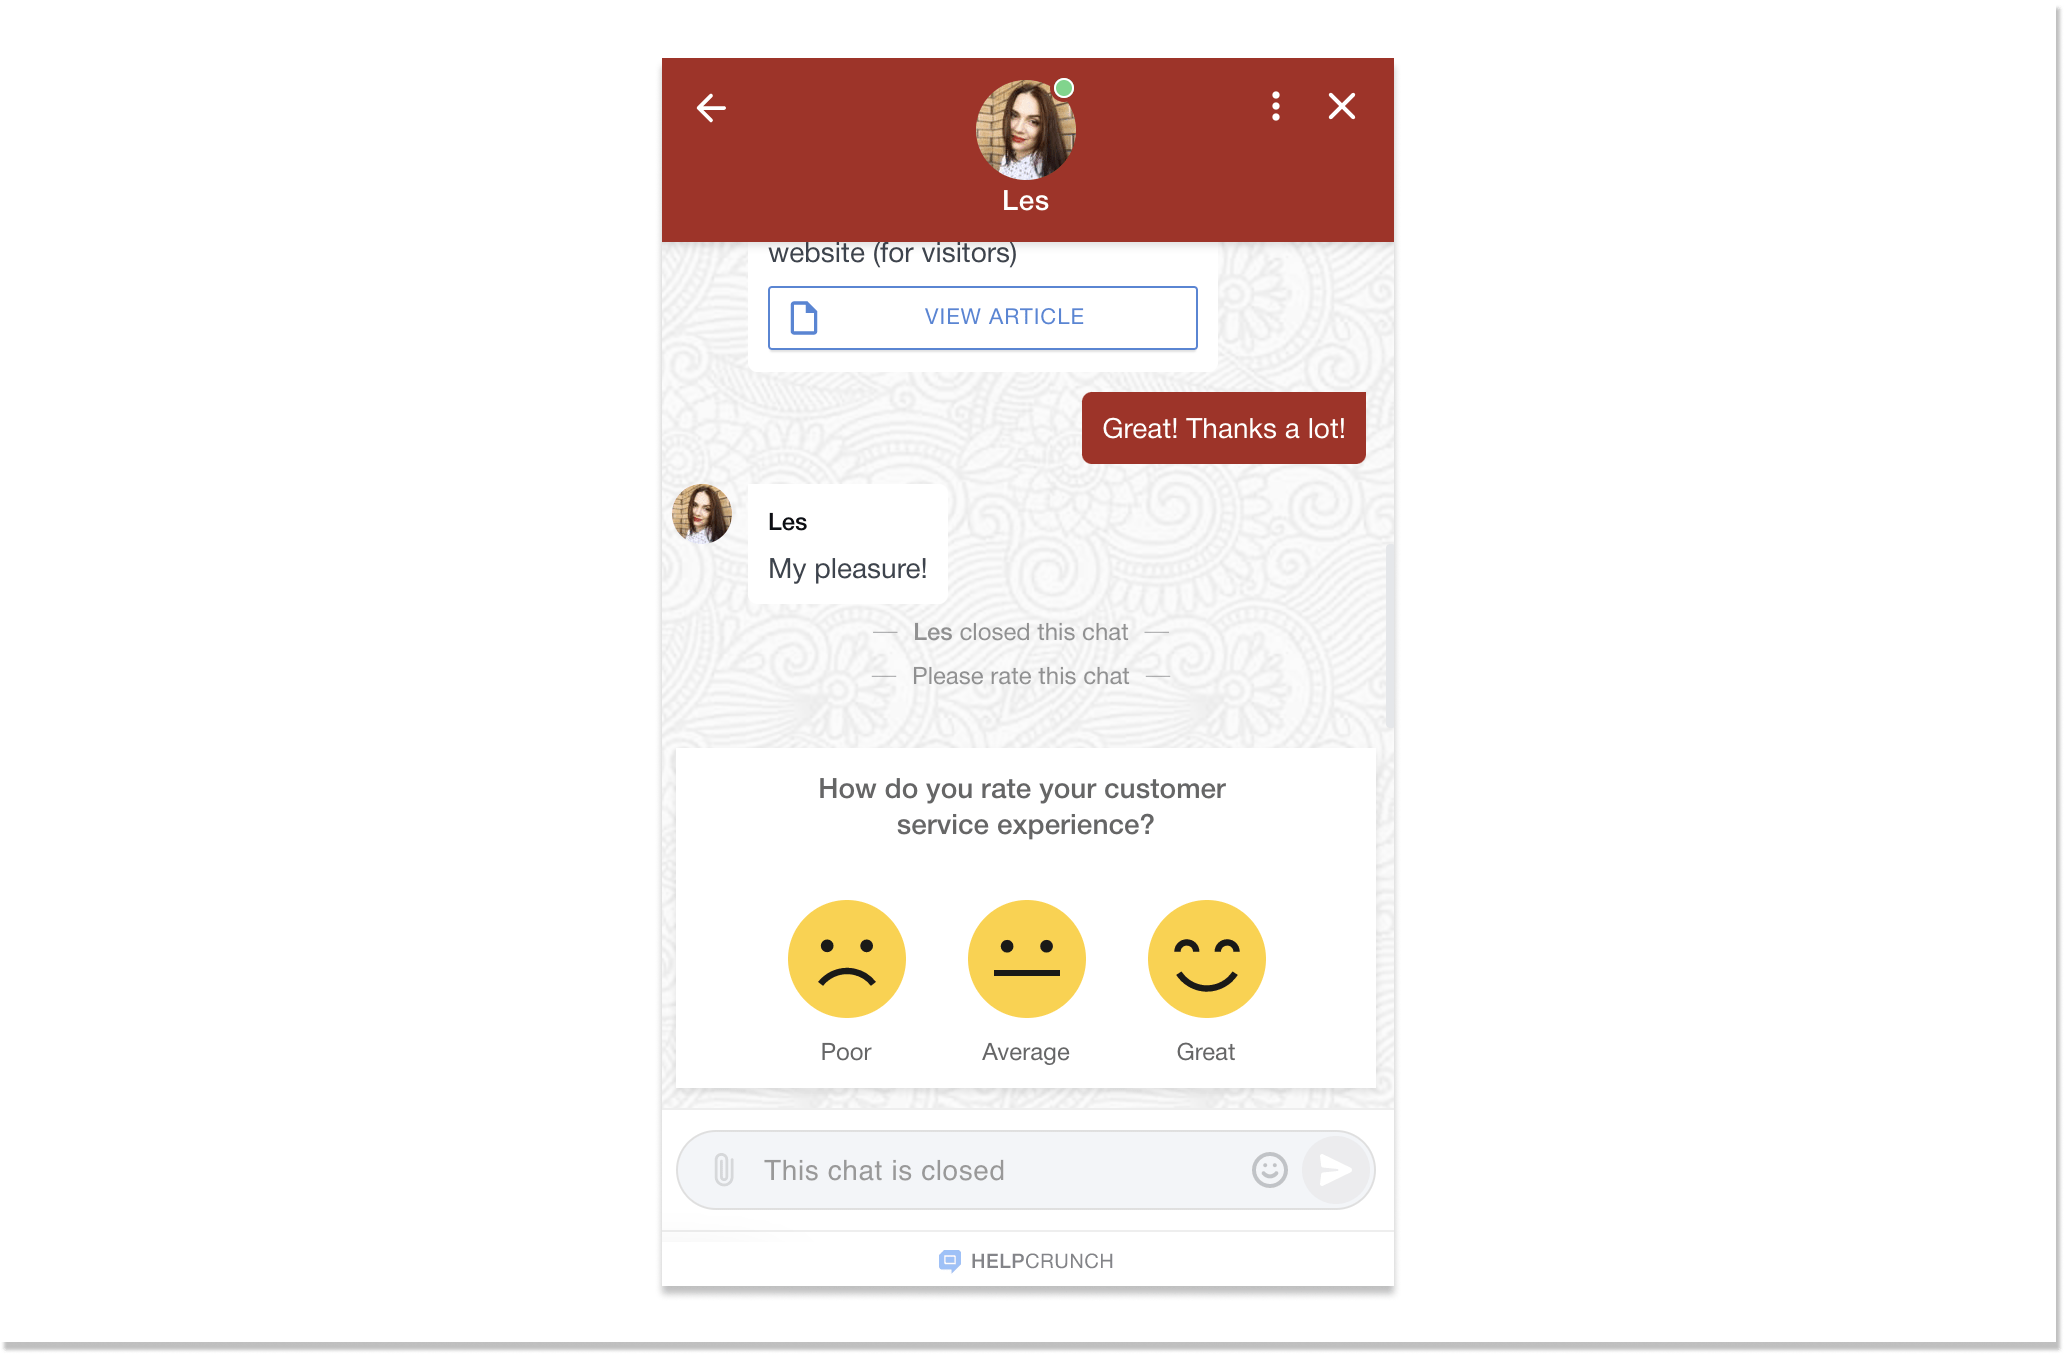
This information can be collected through in-app surveys or email campaigns. If I were to ask, I would choose the first option as it may show a better response rate. A user stays in your app and you ask them in the context. For instance, use a sliding-numerical scale or just ask how a customer can rate their service experience.
In-app survey software can help you measure NPS in no time. The options are multiple: Survey Monkey, UserVoice, Mopinion, to name just a few.
Your existing clients, especially when your user base isn’t big enough at first blush, are the most valuable marketing asset. They can work for your benefit by getting your product in front of so many eyeballs. Plus, the leads they bring are of the highest quality.
Make sure the NPS is strong enough when measuring customer engagement. You want exponential growth and long-term perks, don’t you?
How to calculate NPS?
According to the general NPS benchmark, a positive score or above 0 is “good”, +50 is “excellent”, and +70 is “world-class”. To evaluate NPS, you need to deduct the number of those who are eager to promote your product from those who are not.
NPS = % Promoters – % Detractors
For instance, if you have 70% Promoters and 10% Detractors, your NPS score is 60%.
2. Customer satisfaction score
Customer satisfaction score (CSAT) tracks how pleased your customers are with a product or service. It is measured by one or a set of questions that usually appear at the end of a customer feedback survey. Besides, it’s similar to NPS. One difference here is that NPS measures loyalty and CSAT is all about satisfaction.
For instance, ask the following: “How would you rate your overall satisfaction with our service?“. And then, include a numbered scale with options:
- Very unsatisfied
- Unsatisfied
- Neutral
- Satisfied
- Very satisfied
How to calculate CSAT?
A composite Customer Satisfaction Score (an average rate) can be achieved by taking the number of satisfied customers (the highest values which are 4 and 5) and dividing them by the number of survey responses. Results are typically shown in percentage, with 100% representing complete satisfaction.
(Number of satisfied customers (4 and 5) ÷ Number of survey responses) x 100 = % of satisfied customers
3. Customer lifetime value
Among other engagement metrics, there is one that measures the amount of revenue a business can expect from a client over the whole period of their relationship. I’m talking about customer lifetime value (CTLV). That is, the longer a client continues to purchase from a brand, the higher their CLTV
The odds of selling to an existing client is 60-70%, while the odds of selling to a new one is only 5-20%. That’s why investing in your current client base has the edge.
This user engagement metric is easy to monitor: you don’t have to be bogged down in heavy calculations. All you have to do is realize your customer experience flow and measure feedback across all key touchpoints.
How to calculate CLTV?
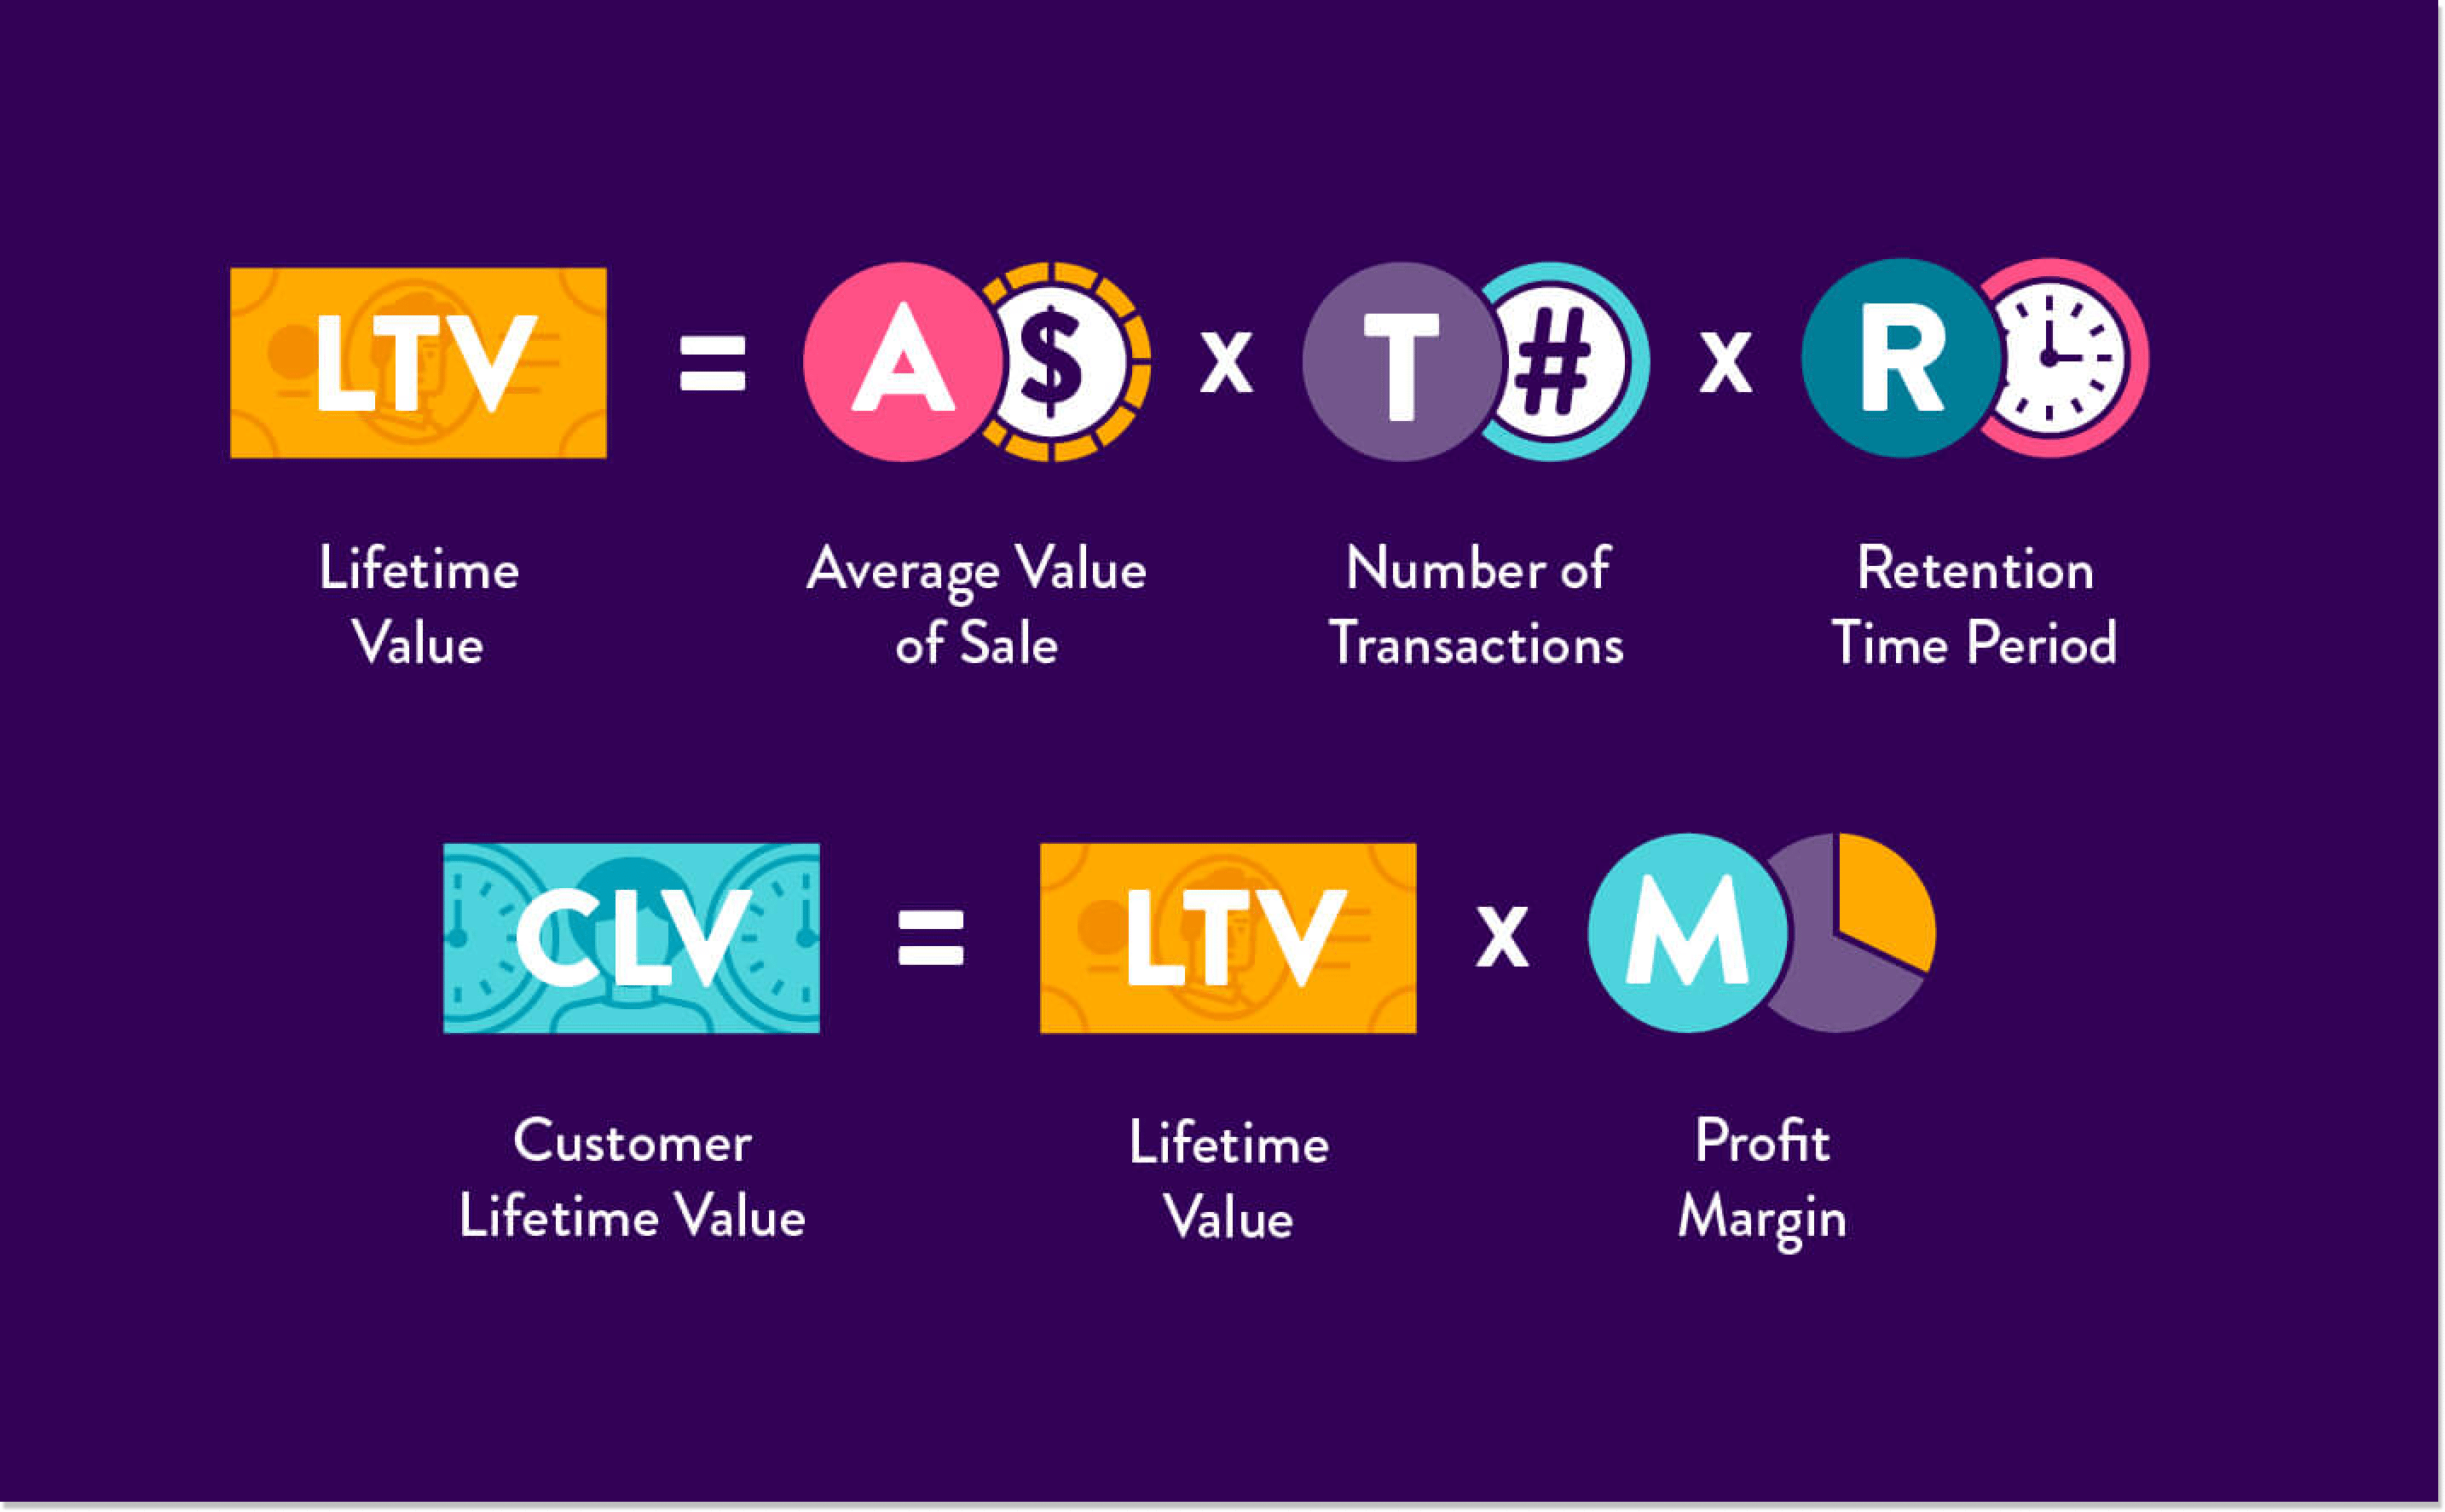
To compute CLTV, you need to find lifetime value first: For that, multiply an average value of the sale by the number of transactions a user did and a retention time period.
LTV = Average Purchase Value × Number of Transactions × Retention Time Period
After that, you can calculate CLTV by multiplying LTV by profit margin.
CLTV = LTV × Profit Margin
4. User activity
This customer engagement metric is typically measured within a temporal window: Daily Active Users (DAU) and Monthly Active Users (MAU). If you monitor at least one of these markers, you’ll be able to see how many unique clients are using your product or service during a particular time interval.
DAU is sometimes thought of as a vanity metric. But that only happens if companies interpret this user engagement criterion wrong. Sure, it varies from industry to industry, but in the majority of cases, it’s counted as a unique user logging into your app. To be more precise, you should keep close tabs on such actions as:
- Adding a team member
- Sharing with a friend
- Creating a report
As the name suggests, MAU refers to people who are engaged with your product in one way or another within a monthly period. Despite its importance, many world-famous companies experienced inaccuracies. After Twitter lost 9 million users in a quarter, it has stopped giving up information on its MAU numbers and started using another metric (mDAU: monetizable daily active users).
How to calculate DAU/MAU?
Unlike other user engagement metrics we talk about here, you should check if customers stick with your brand to determine this one. Just compare your daily active users with monthly active users. If there’s a serious gap, no time to waste: rethink your bottom line and find other methods to show precise value.
5. Week #1 user engagement
Measuring engagement during the first week of a user’s activity in your product or service is similar to DAU/MAU. If a client expresses no interest right after they gained access to an account, they aren’t likely to come back. It means that something goes wrong in getting users hooked.
Week #1 user engagement illustrates whether your internal processes are well-built:
- Intuitive client onboarding
- Great user experience
- Overall users’ excitement about your product
6. Visit frequency
As you can guess, the given engagement metric is used to describe how often a user gets back to your service. This is a primary representation of the value they get from what you do.
By tracking visit frequency, you can gain insights into many potential patterns in customer behavior. Plus, it’s better to divide it into groups for convenience: “everyday use”, “weekly use”, or “sporadic use”.
But it doesn’t mean every business should measure customer engagement based on visit frequency the same way. Given that all customers are different and each brand wants to achieve various goals, you should identify the most relevant pattern for your product or service.
If you expect happy users to come to you every day, measure this engagement metric against that. However, if your service is seasonal and customers are likely to return during holidays, check this pattern, and so forth.
7. Feature usage
To win out your customer engagement strategy, ensure all your efforts aren’t in vain. Otherwise, you just don’t care about your clients. They are the lifeblood of your brand and everything you do for them should be constantly monitored.
There’s always room for perfection. Make a smart move and ask your clients what feature they would like to test next and what should be improved.
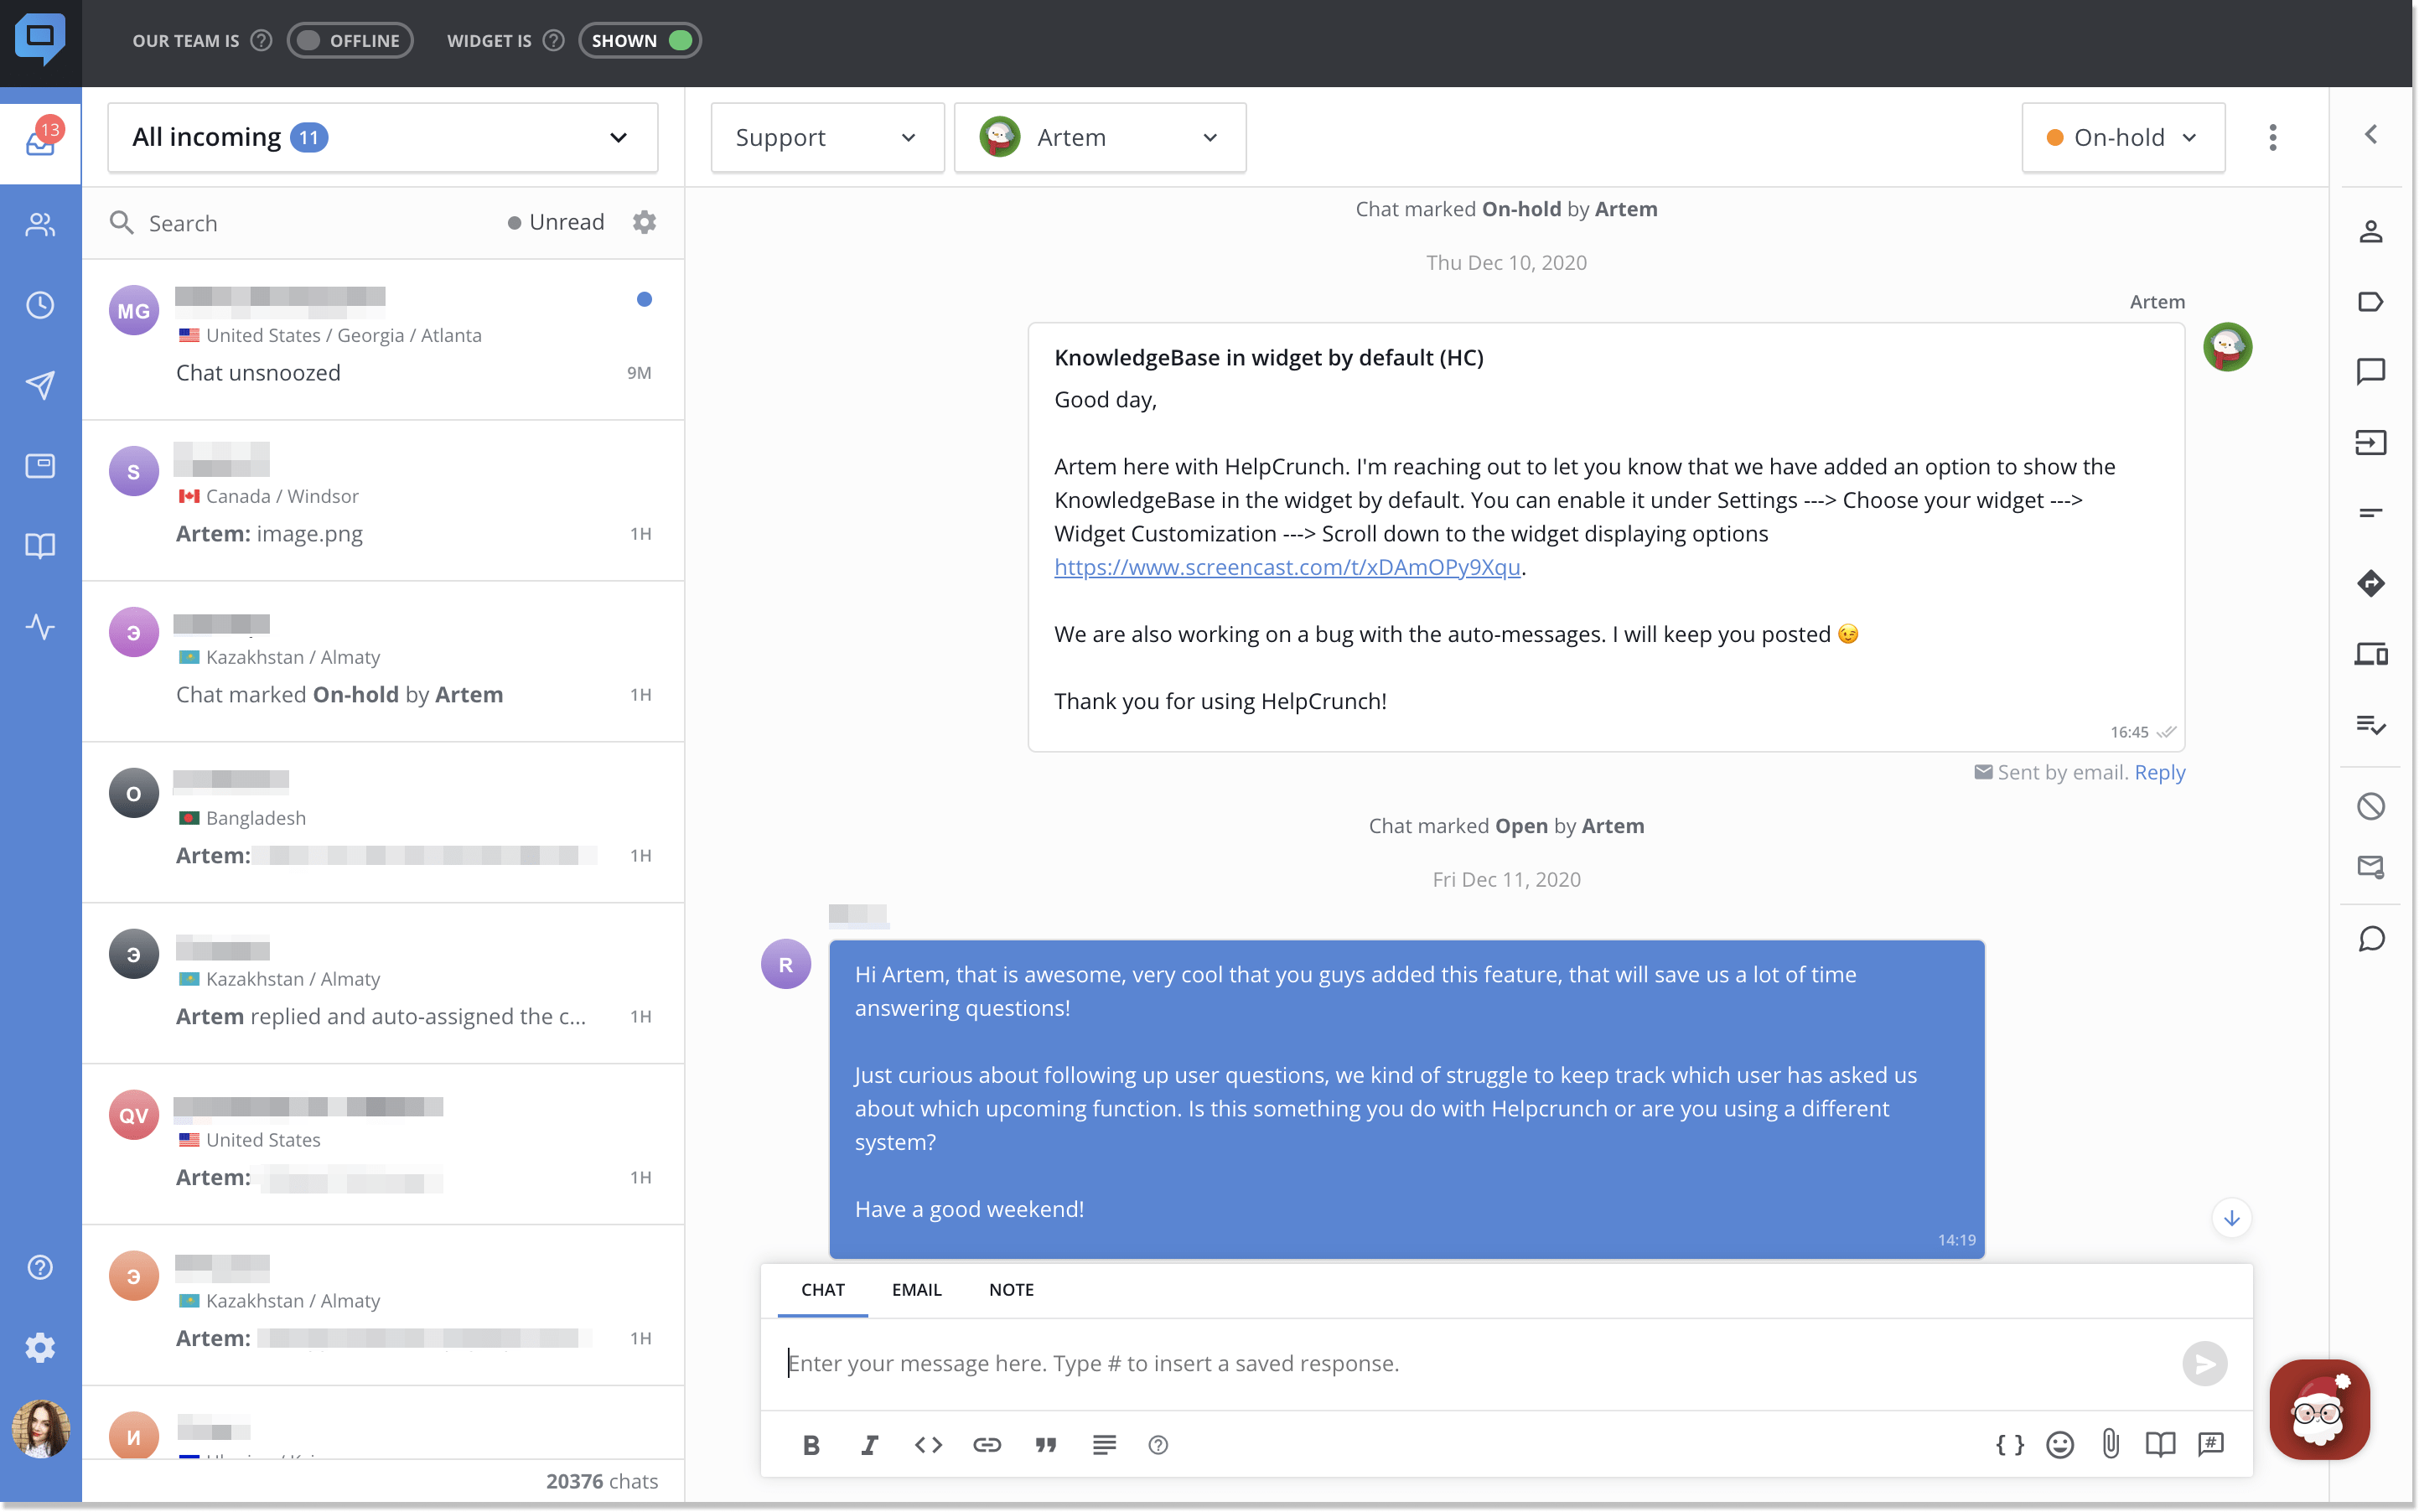
We at HelpCrunch are serious about this customer engagement metric and survey our clients about their thoughts, likes, and wishes. Once we release a new feature, our success managers inform everyone who waited for it. This is a great way to enhance both customer relations and your product.
8. Churn rate
The churn rate user engagement metric, or attrition of customer churn, is the percentage of clients who cut ties with your product or service during a given period of time. This marker is significant for those companies whose customers repeatedly pay: SaaS or other subscription-based organizations. The lower your churn rate is, the more customers you retain. Typically, the lower your churn rate is, the better.
Realizing your churn rate is essential for assessing the effectiveness of your marketing efforts and overall customer satisfaction. Everything comes down to knowing where, when, and why users go away.
How to calculate the churn rate?
To puzzle out the formula, let’s look at the example. Company Z had 500 customers at the beginning of the month and only 400 at the end of the month. So, we need to take away 400 from 500, divide it by 500, and multiply it by 100%. The churn rate will be 20%.
Churn rate = The number of clients [beginning of a time period] – The number of clients [the end of a time period] ÷ The number of clients [beginning of a time period] * 100%
Final words
Hopefully, this insightful guide about engagement metrics will help you understand whether your business operates well and how you can fine-tune all campaigns to resonate with target audiences.
No matter what metric will be leading for you, it will take the guesswork out of your approach. Focus on your customers’ preferences, behavior, and opt for the powerful tool to keep everything in sight. Sign up for HelpCrunch to engage your clients like never before.